- Home >
- Stock PNGs >
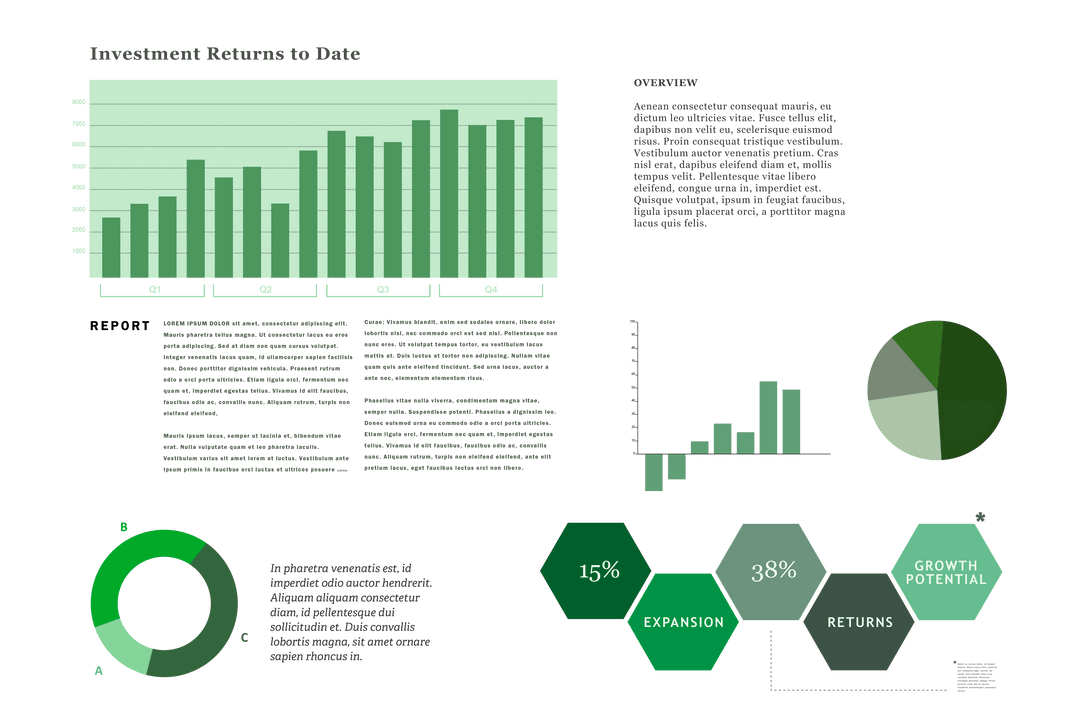
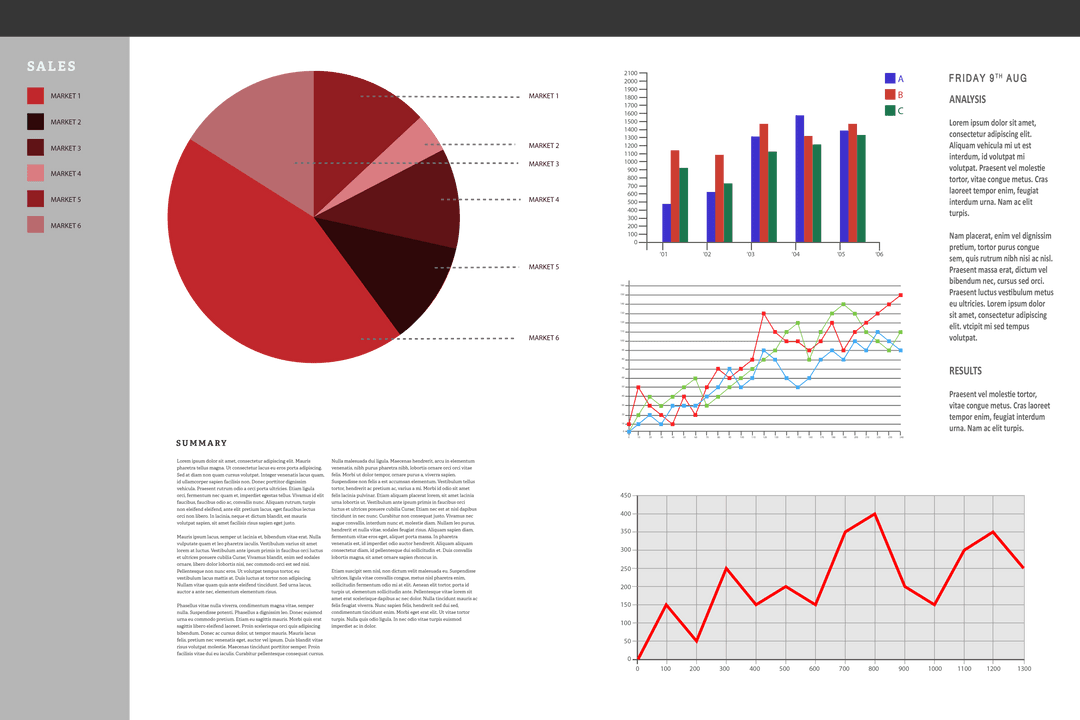
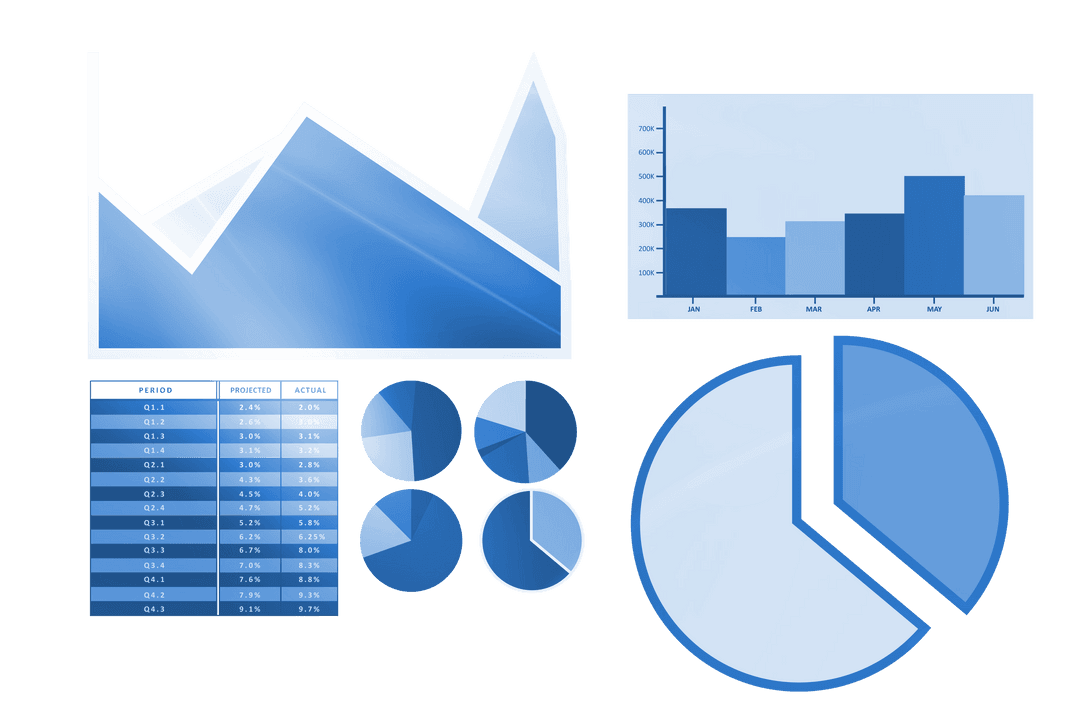
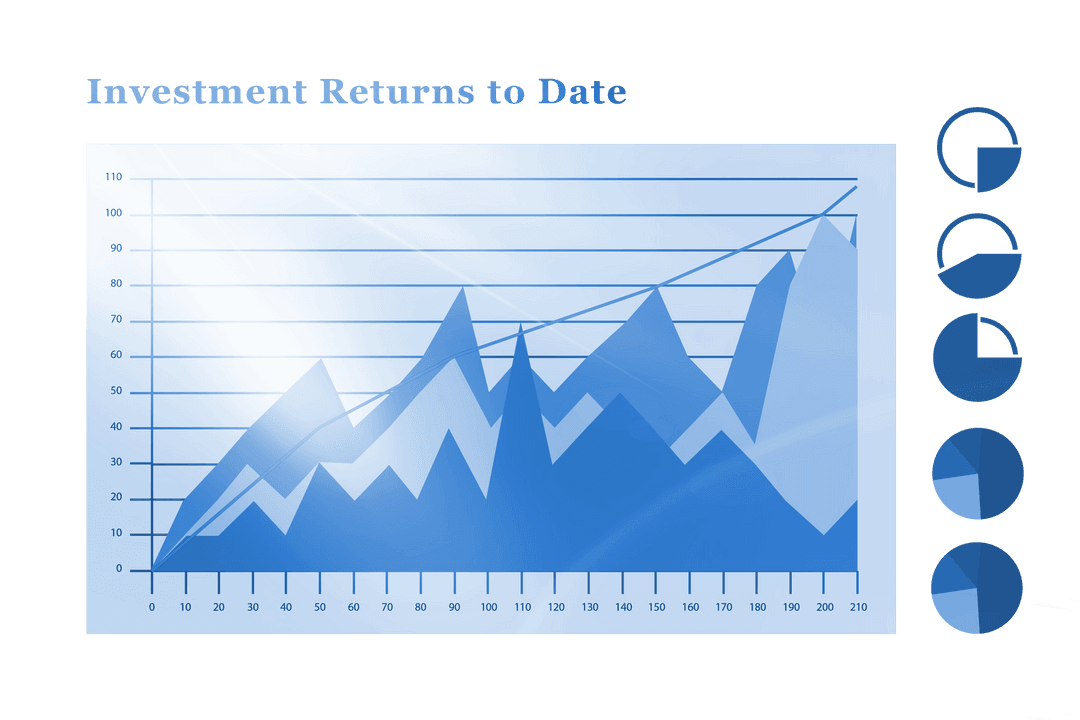
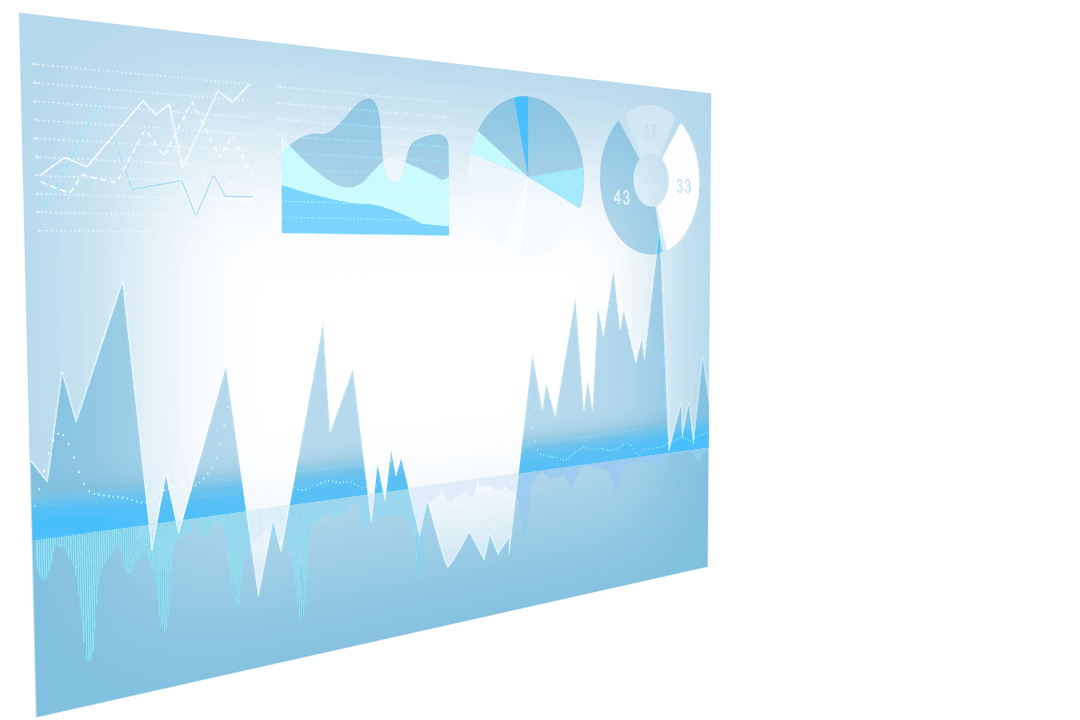
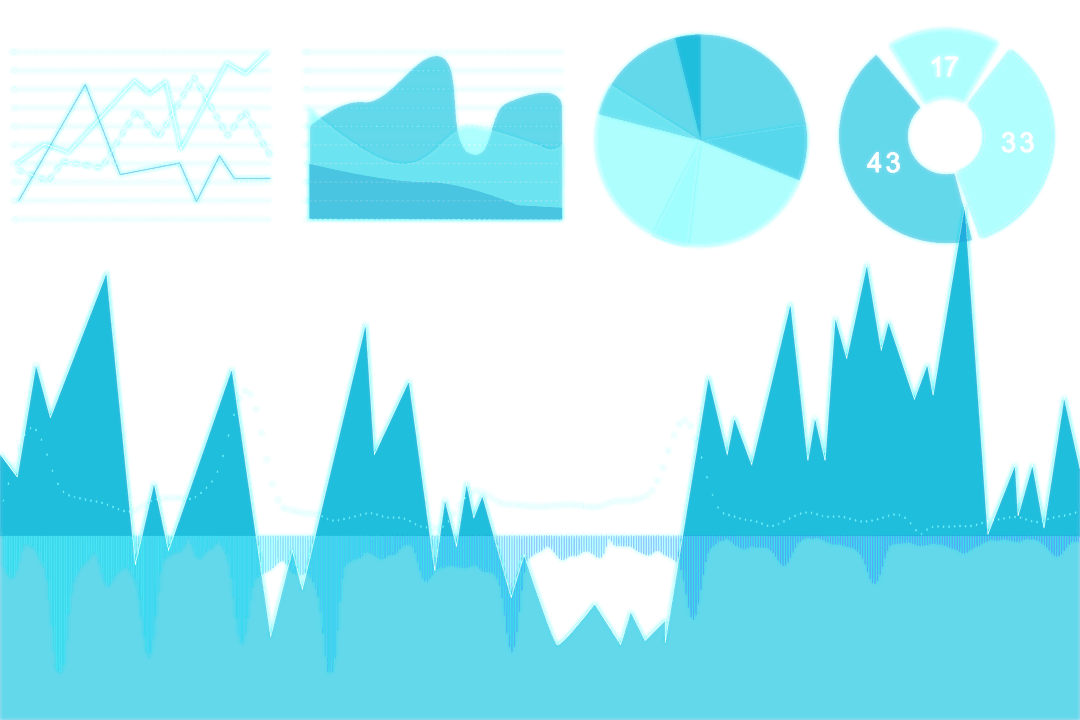
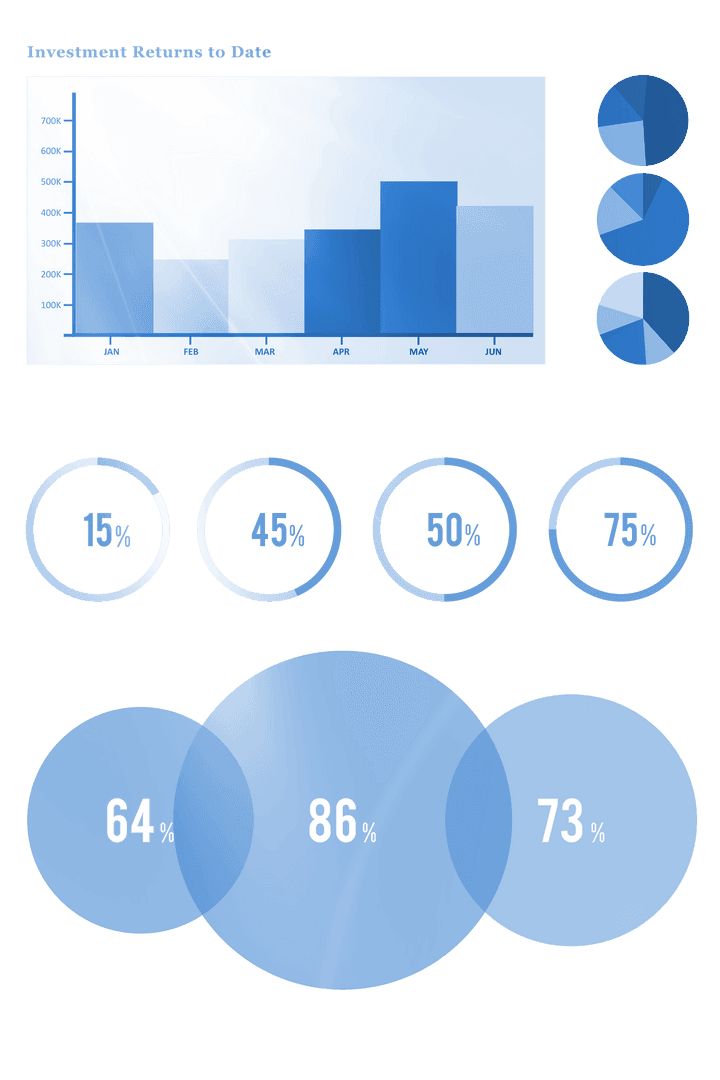
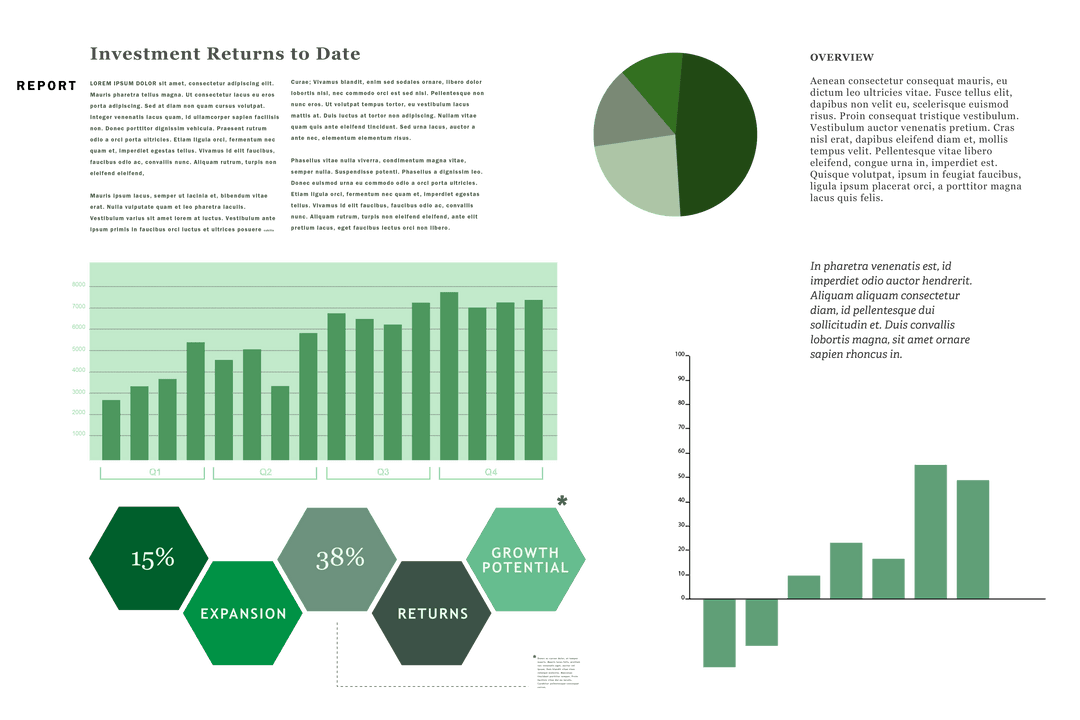
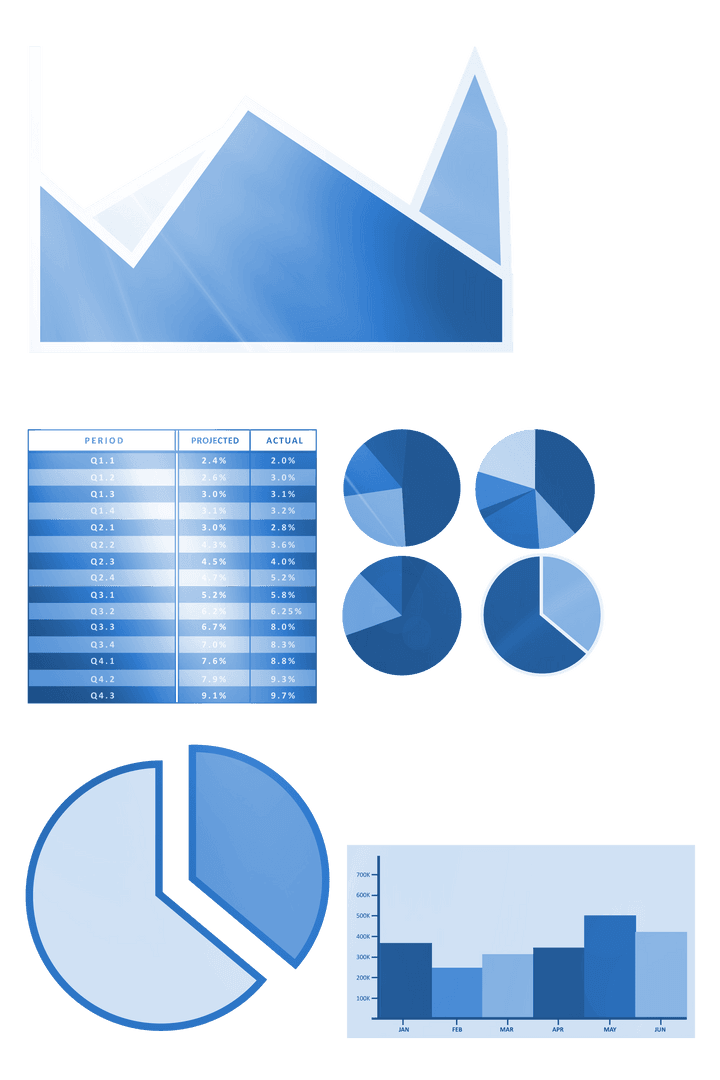
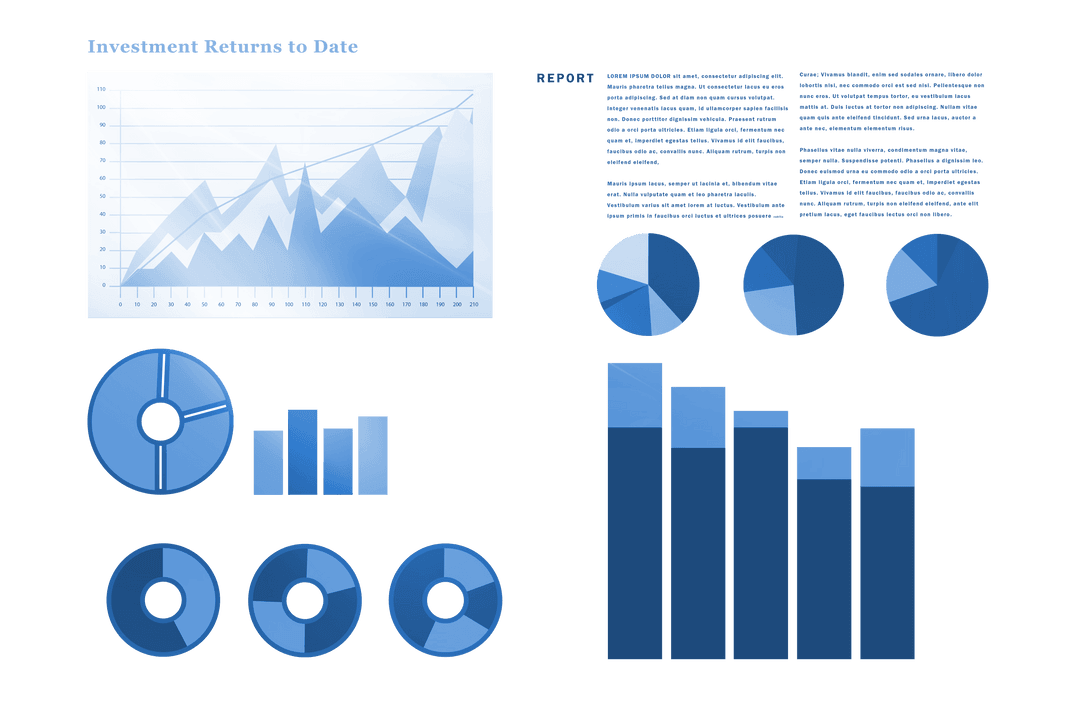
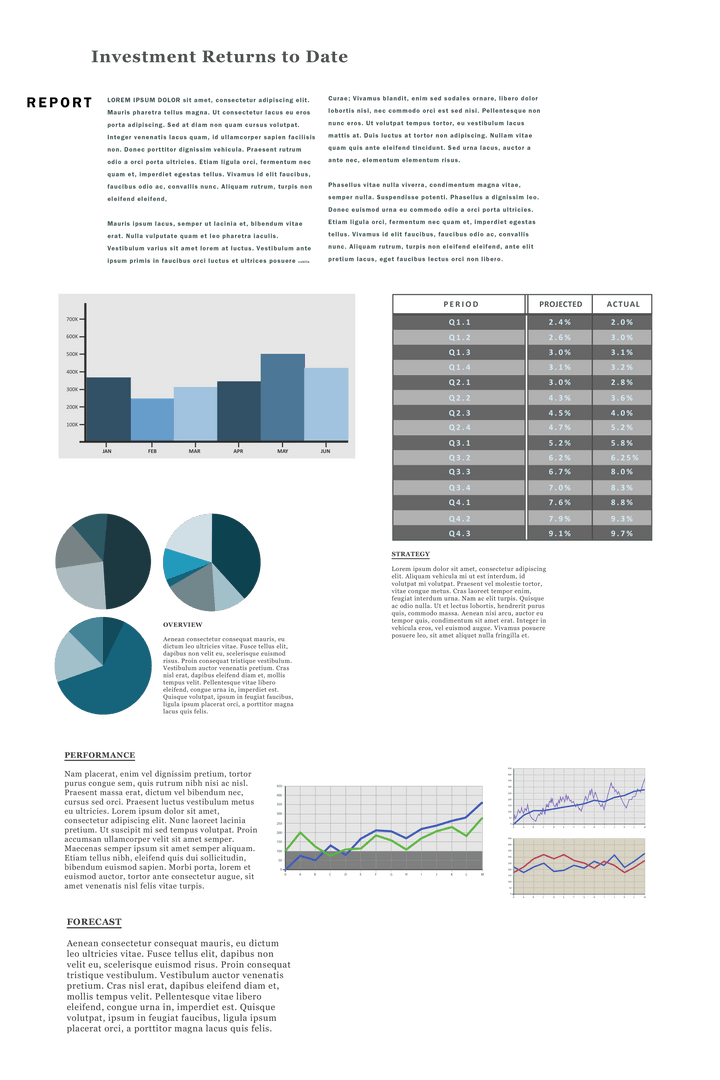
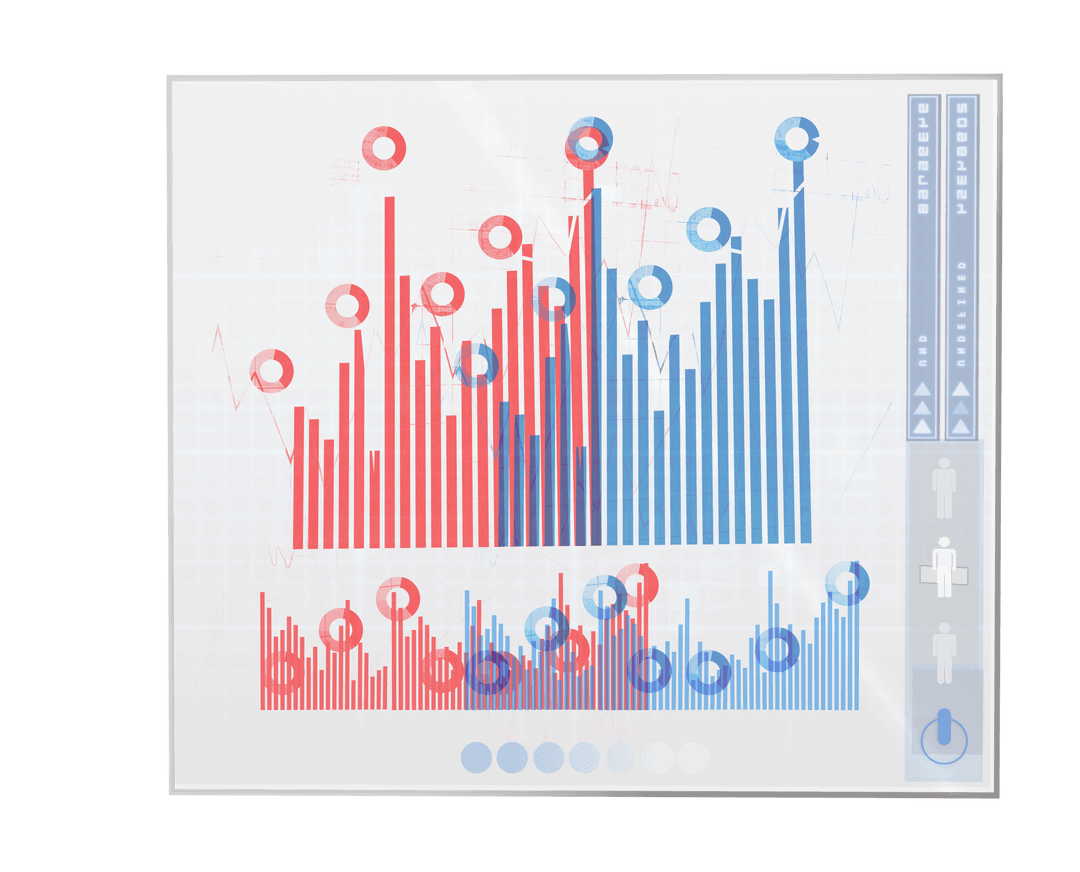
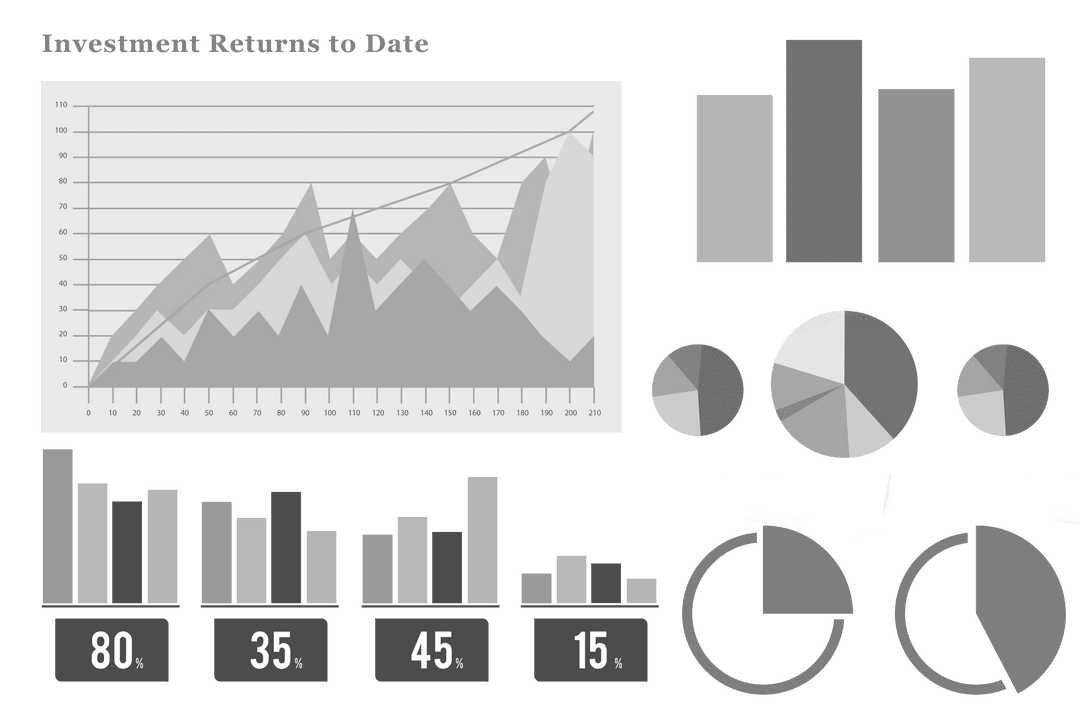
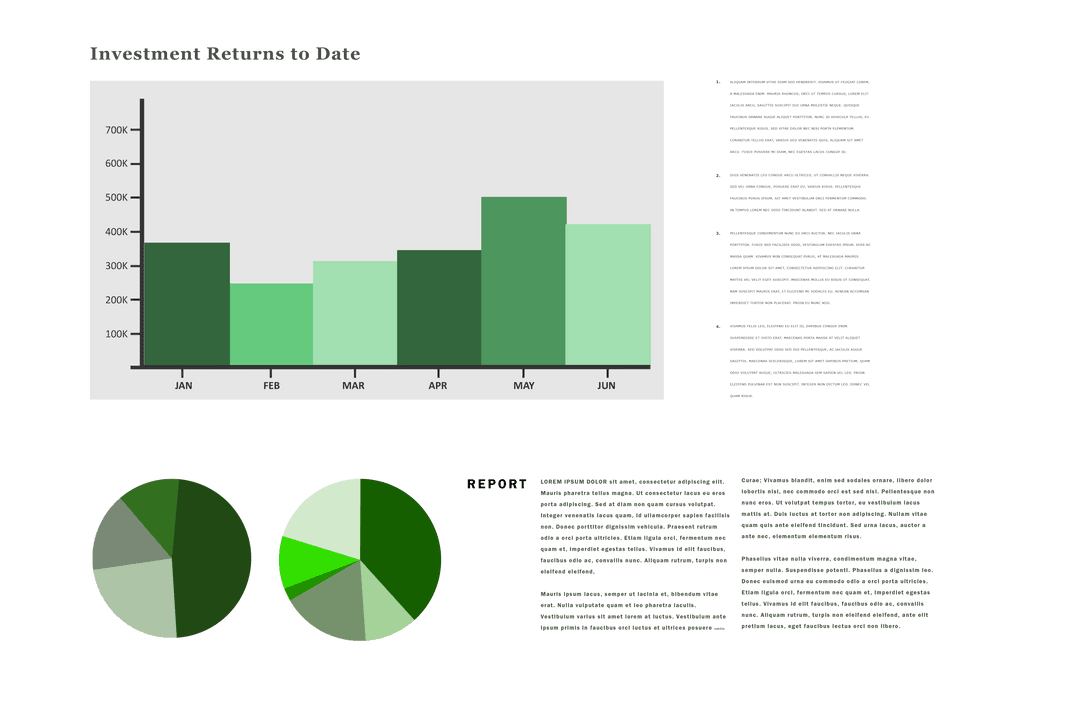
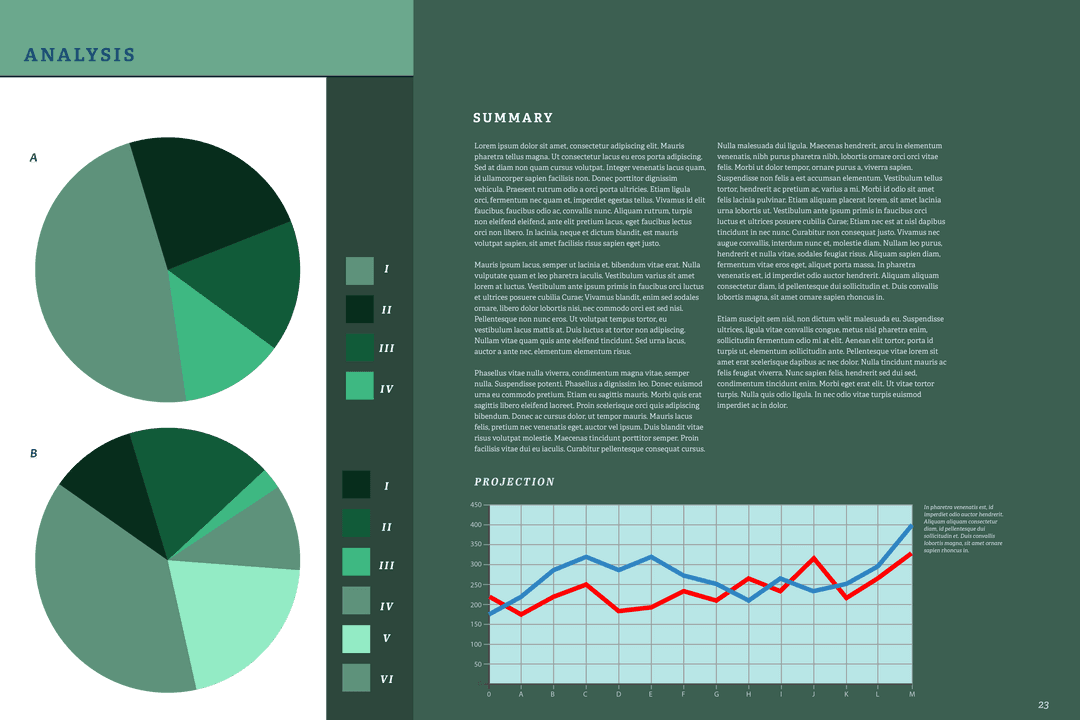
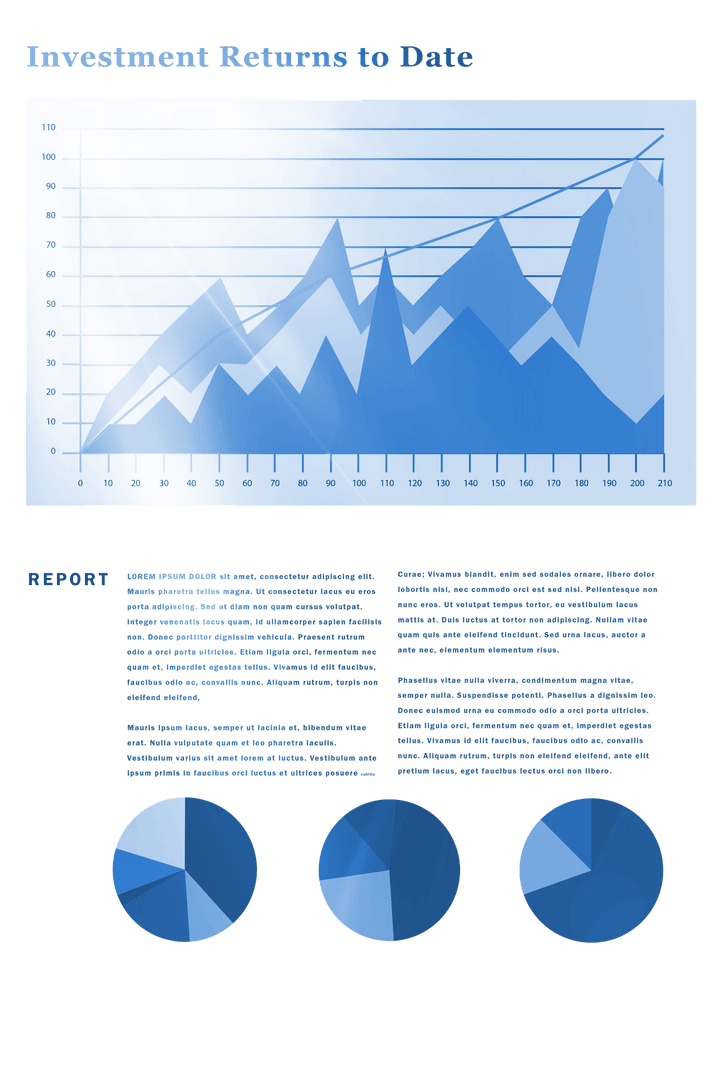
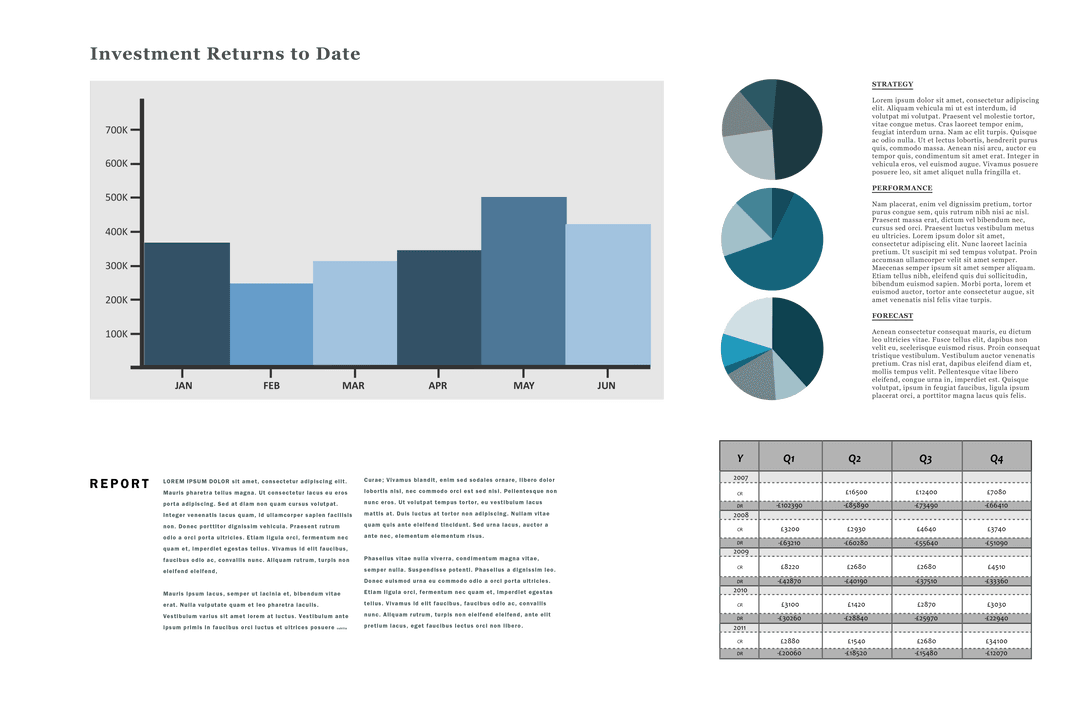
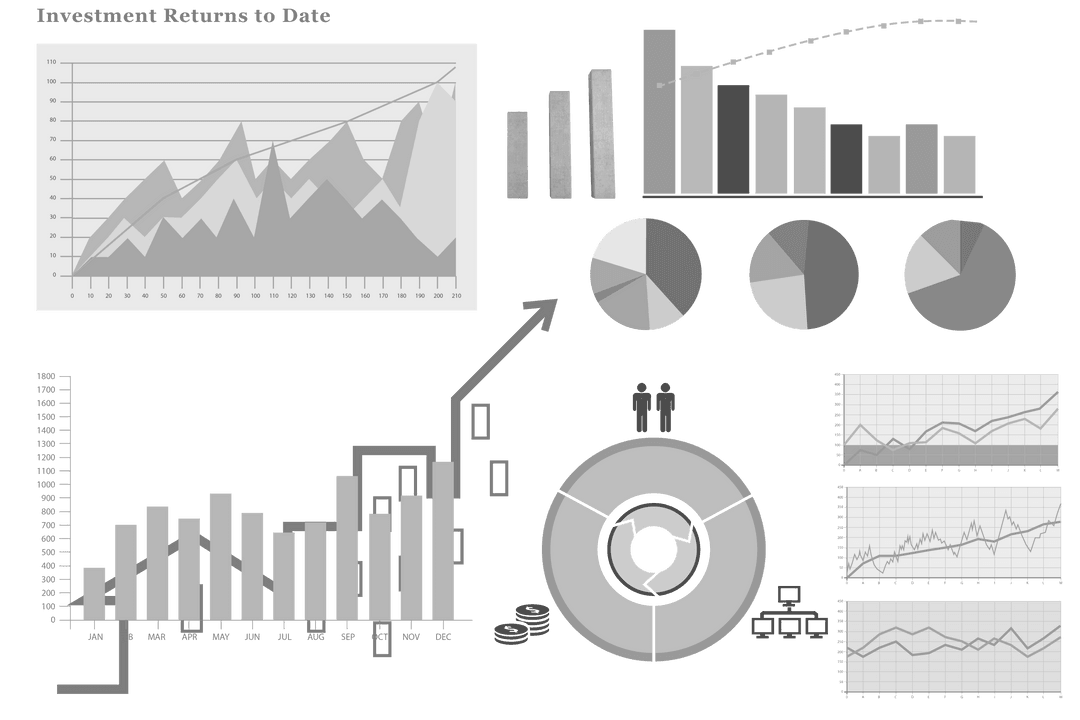
- Investment Diagrams on Transparent Background Vector Illustration
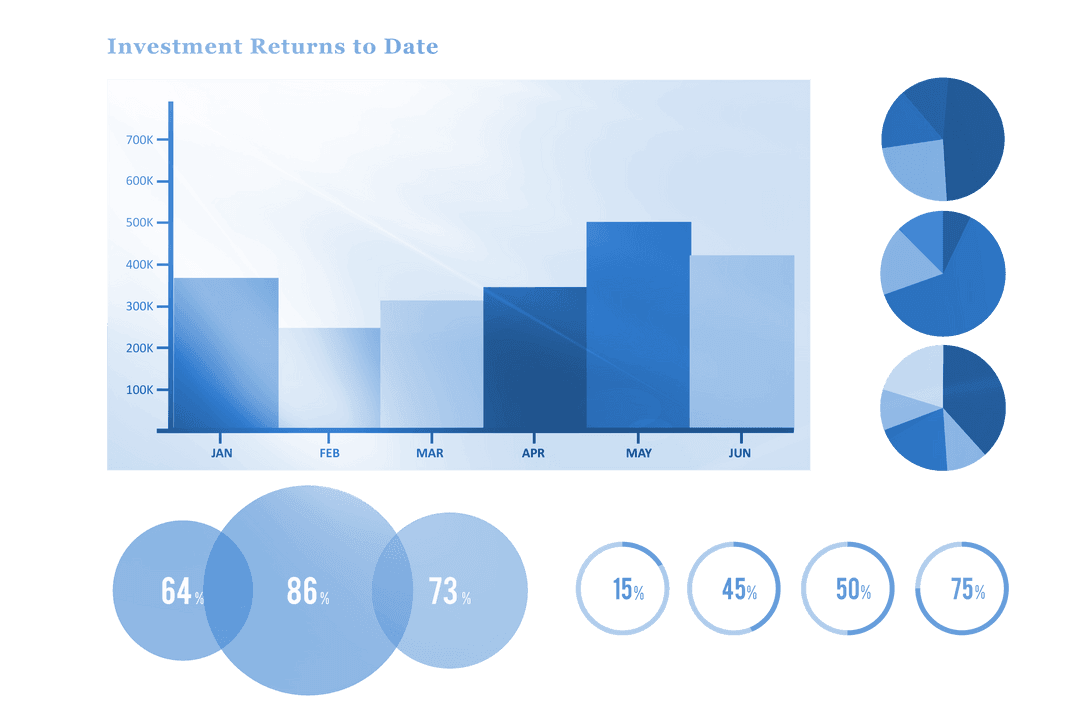
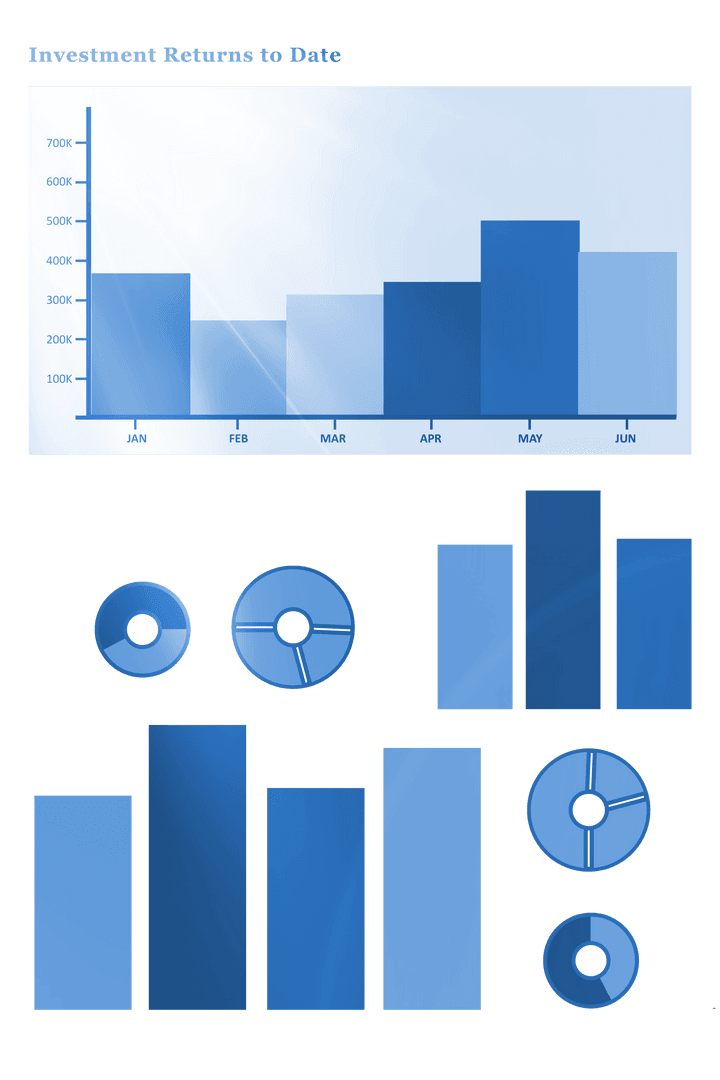
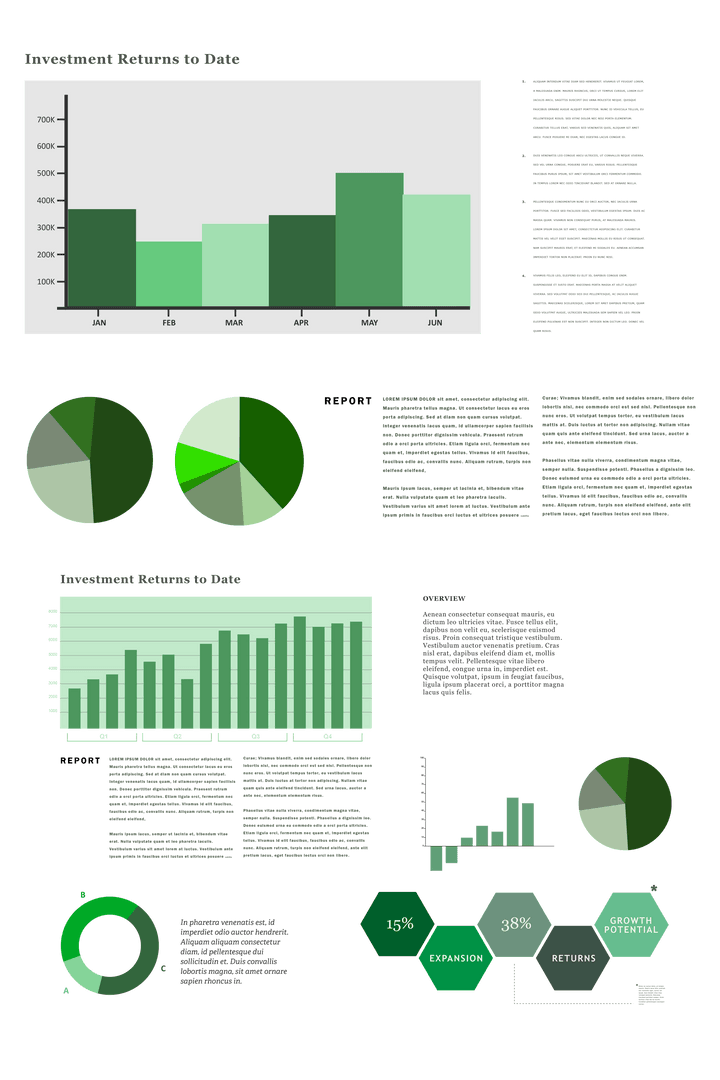
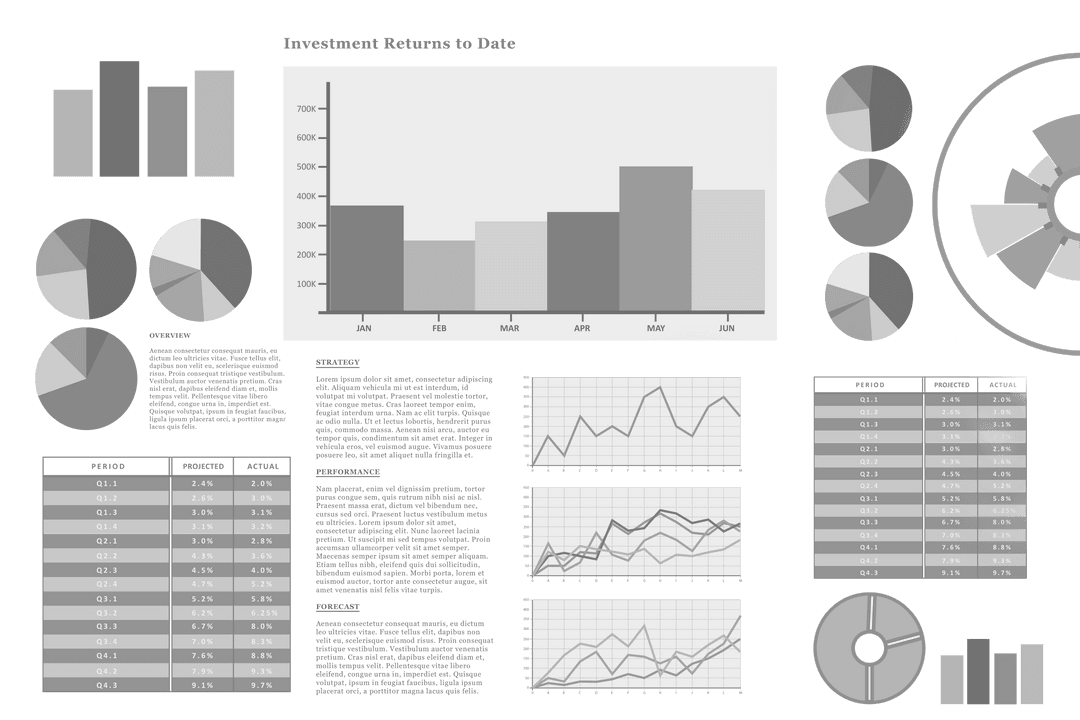
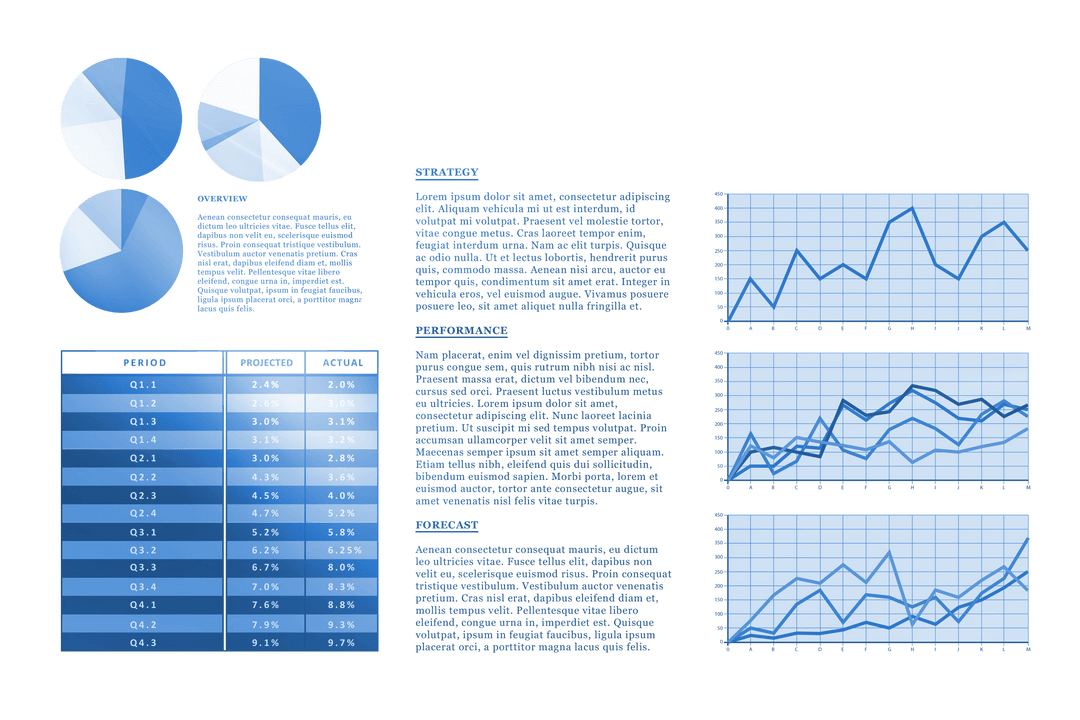
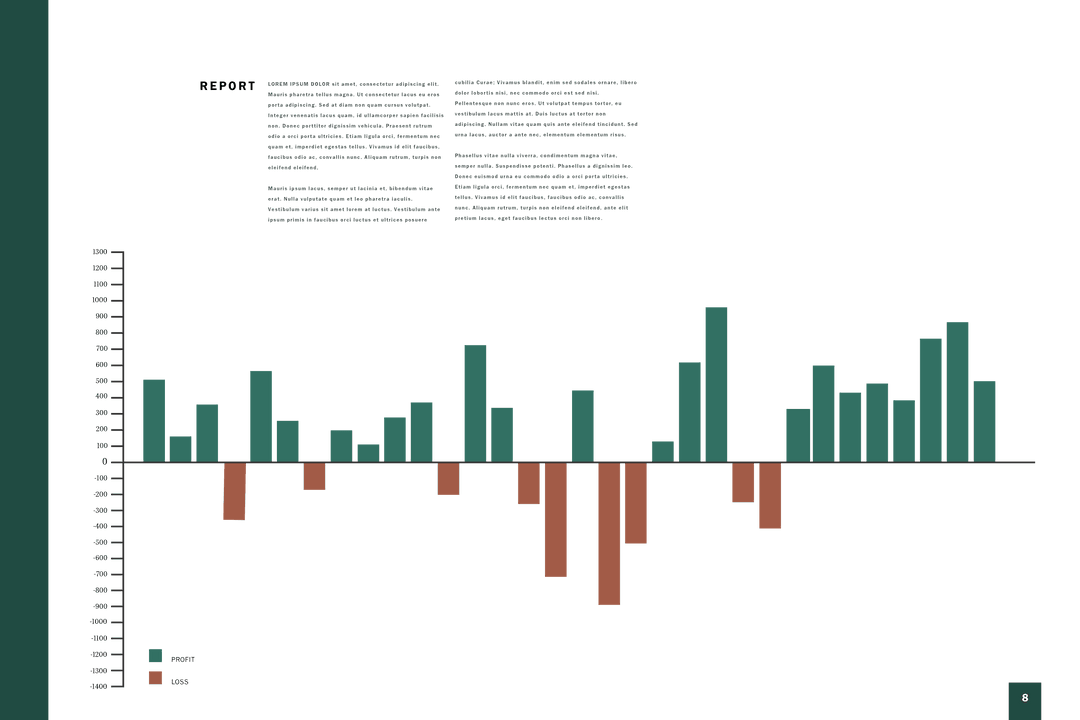
Investment Diagrams on Transparent Background Vector Illustration PNG

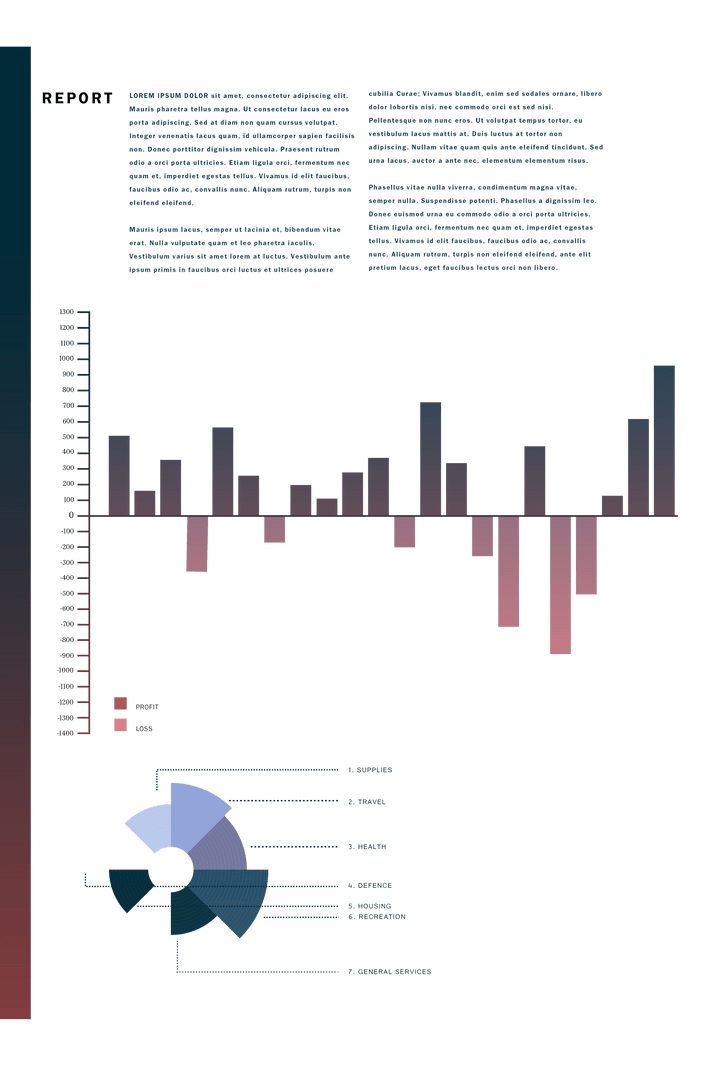
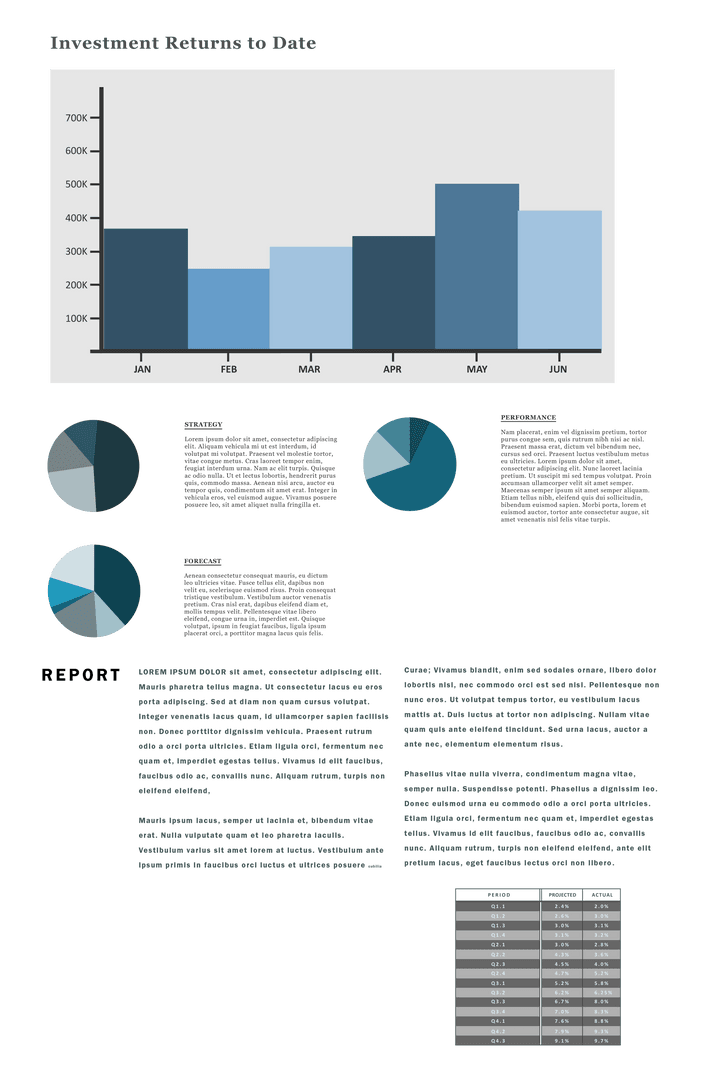
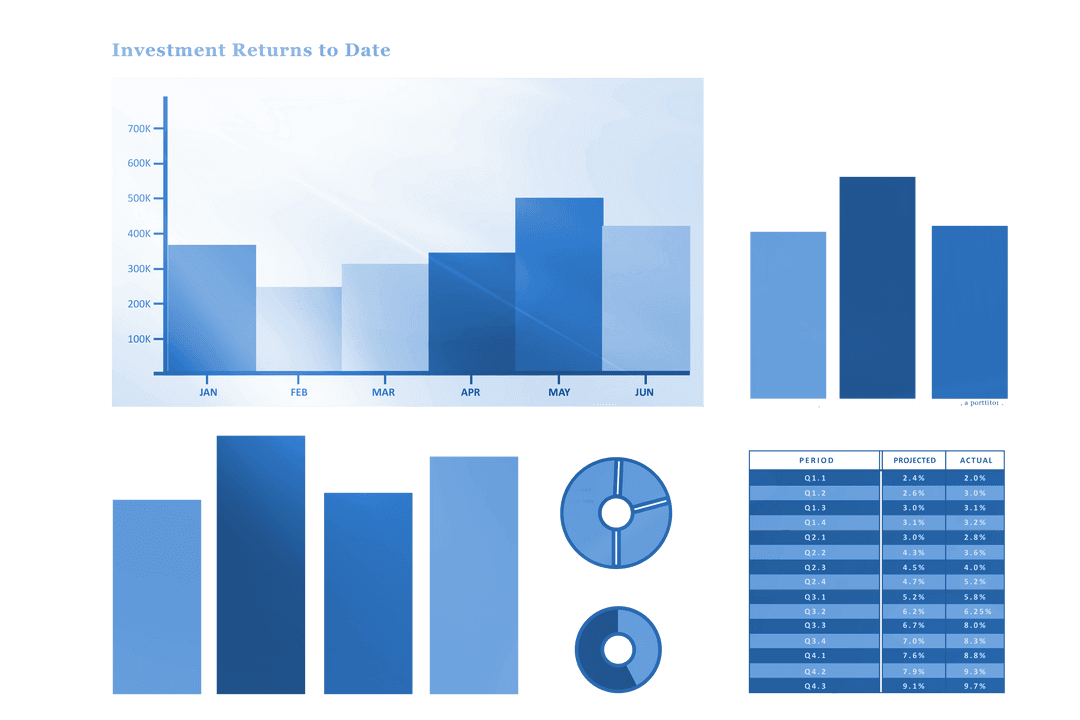
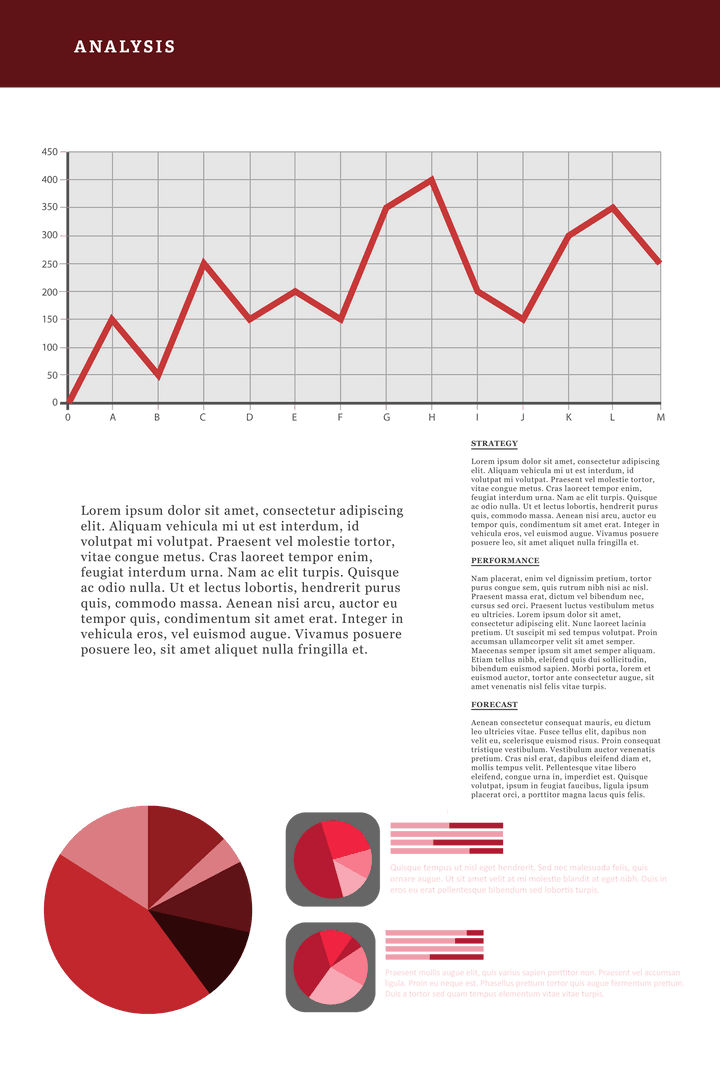
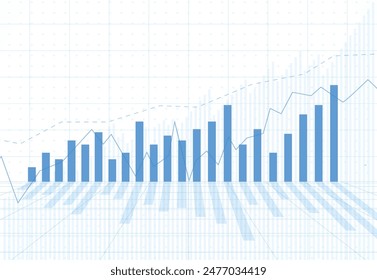
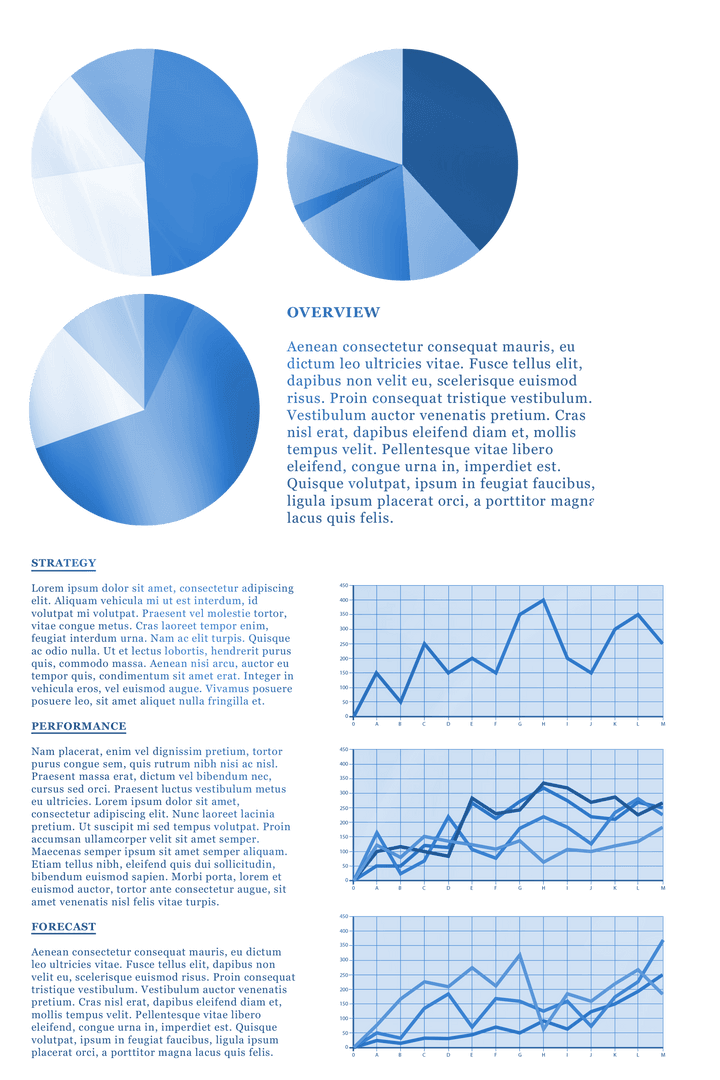
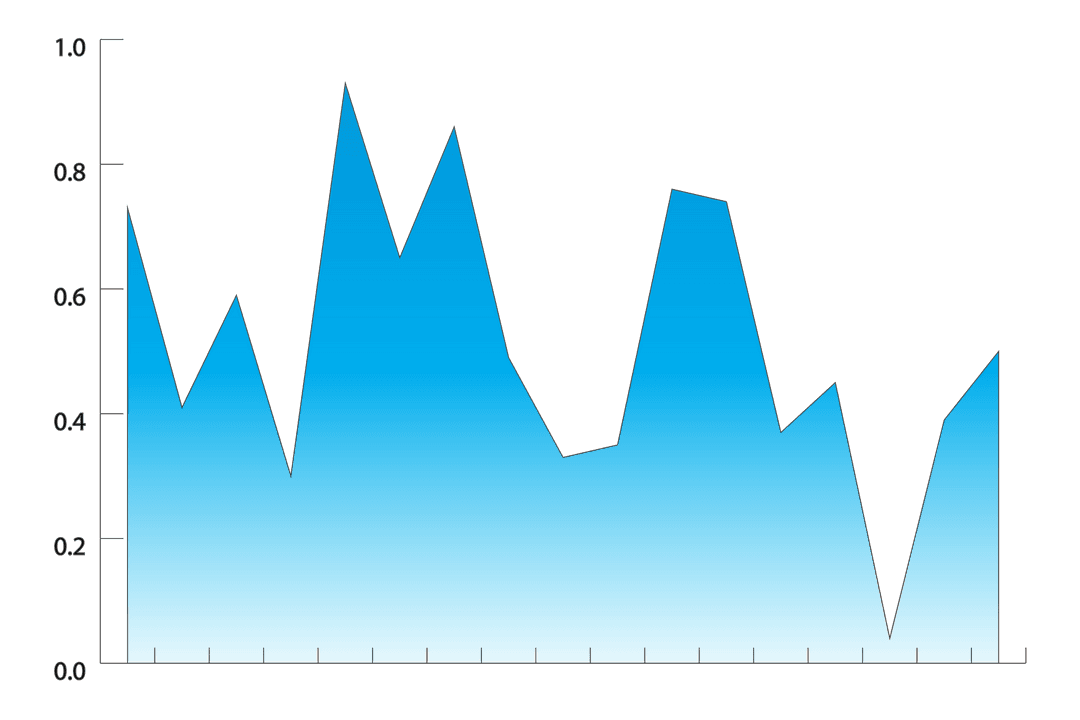
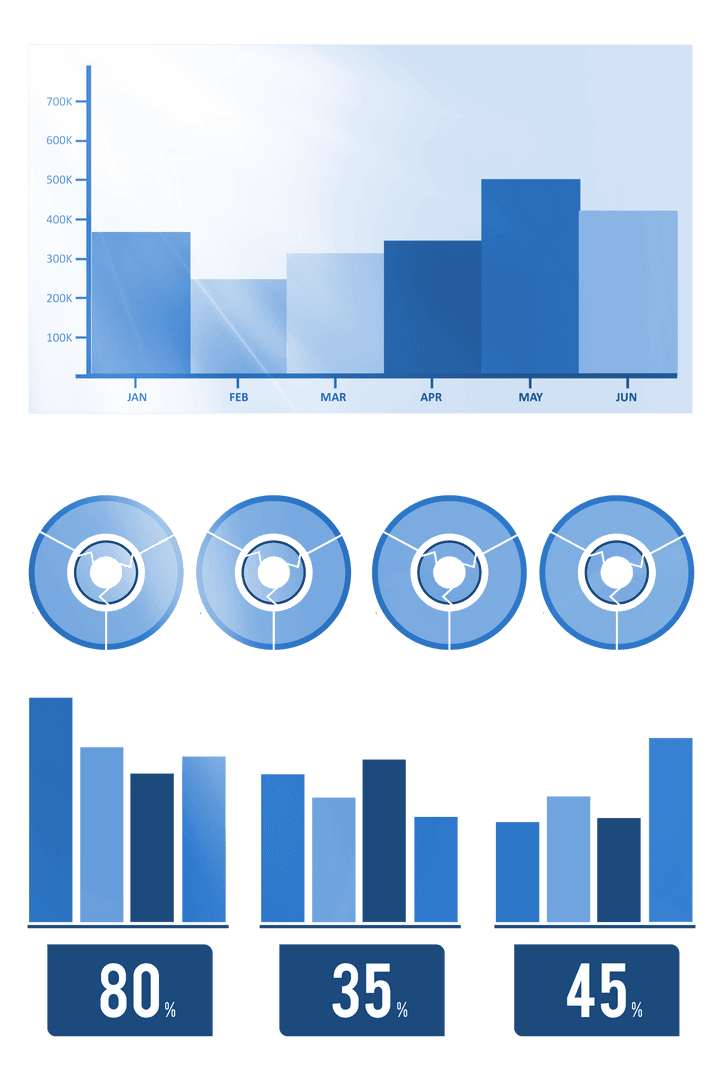
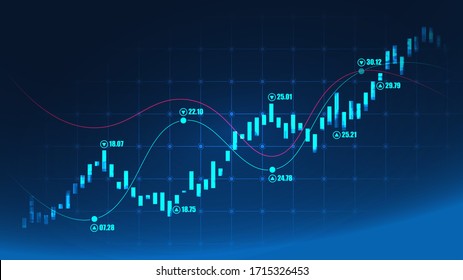
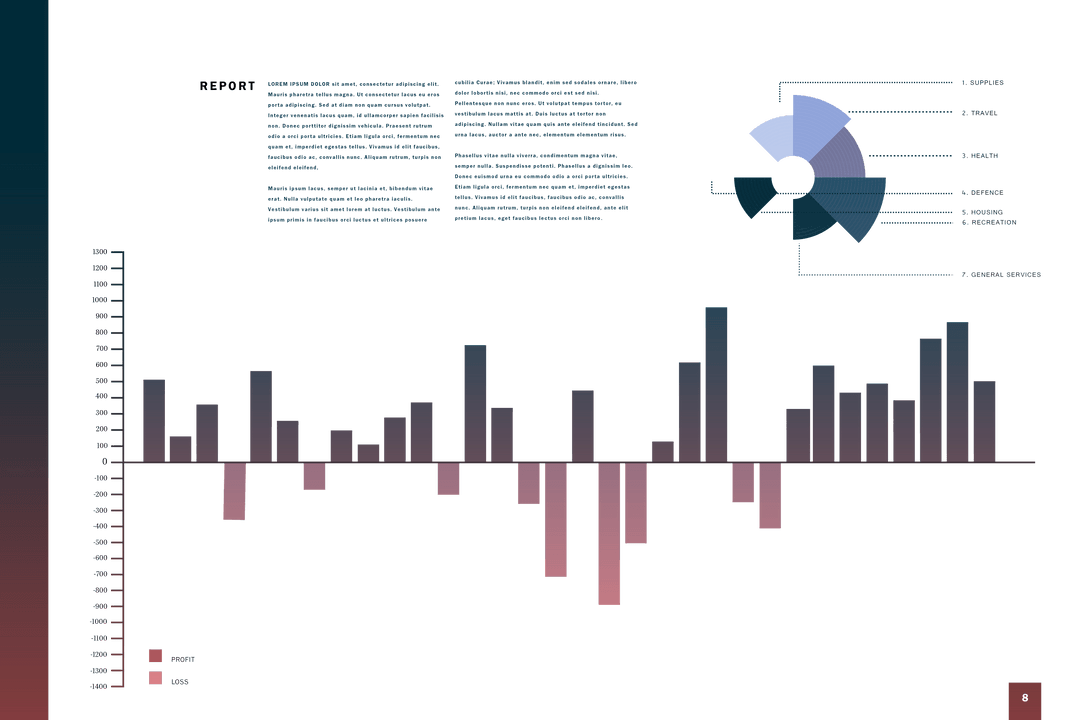
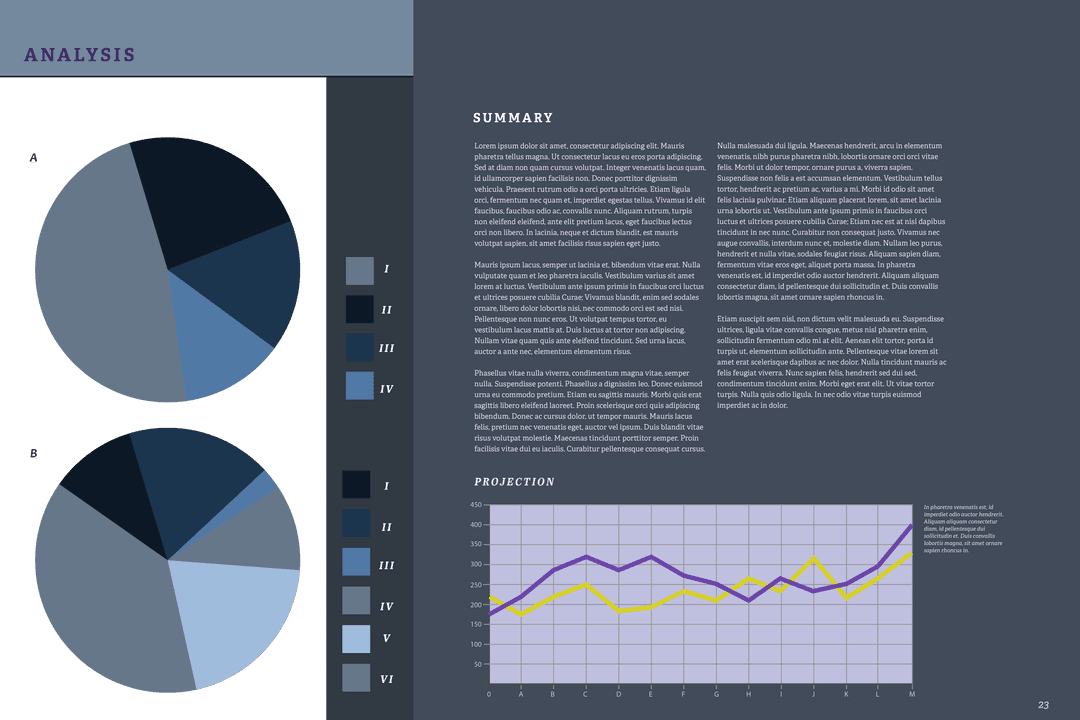
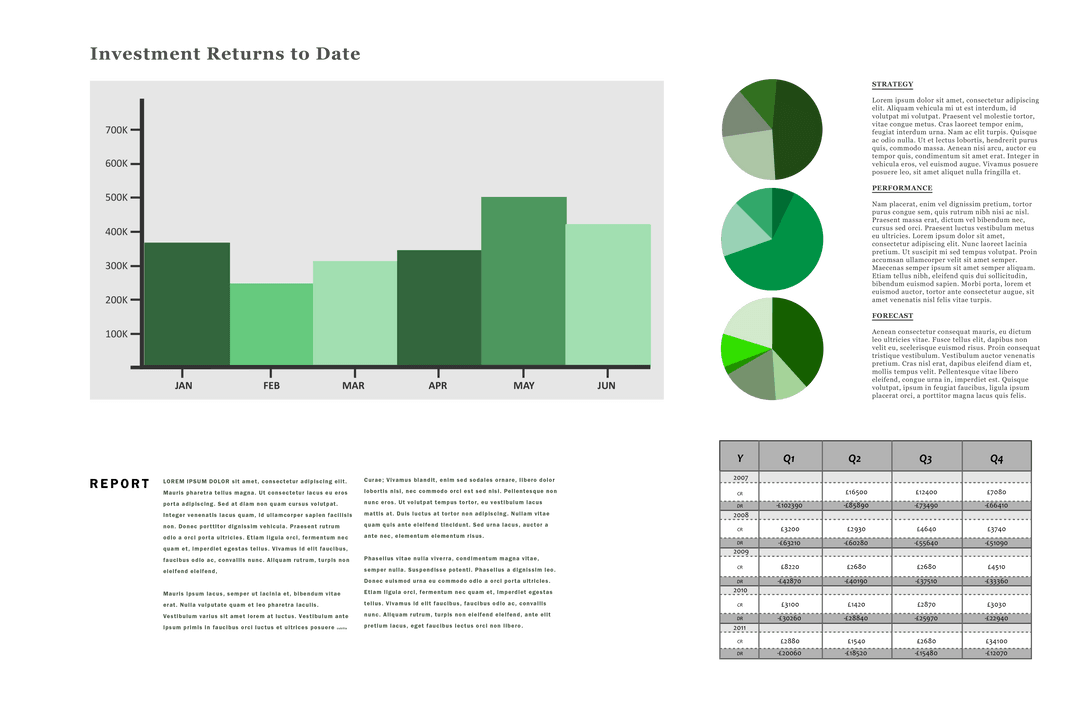
This vector illustration features a variety of diagrams, including line charts and pie charts, over a transparent background. Titled 'Investment Returns to Date,' it showcases graphical representation and analysis of financial data and statistics, making it ideal for financial reports, investment presentation slides, and educational materials related to business finance. Its layout allows for customizable integration into your branding or documentation.
Powered by  - Get 15% off with code: PIKWIZARD15


0
downloads
downloads
Credit Photo
If you would like to credit the Photo, here are some ways you can do so
Text Link
png Link
<span class="text-link">
<span>
<a target="_blank" href=https://pikwizard.com/png/investment-diagrams-on-transparent-background-vector-illustration/ff7b12195c7890f82aa0f89c06da28f6/>PikWizard</a>
</span>
</span>
<span class="image-link">
<span
style="margin: 0 0 20px 0; display: inline-block; vertical-align: middle; width: 100%;"
>
<a
target="_blank"
href="https://pikwizard.com/png/investment-diagrams-on-transparent-background-vector-illustration/ff7b12195c7890f82aa0f89c06da28f6/"
style="text-decoration: none; font-size: 10px; margin: 0;"
>
<img src="https://pikwizard.com/pw/medium/ff7b12195c7890f82aa0f89c06da28f6.png" style="margin: 0; width: 100%;" alt="" />
<p style="font-size: 12px; margin: 0;">PikWizard</p>
</a>
</span>
</span>
Free (free of charge)
Free for personal and commercial use.
Author: Awesome Content
Similar Free PNG Images With Transparent Background
Premium


Premium


Premium


Premium


Premium

Premium


Premium


Premium


Premium


Premium


Premium


Premium


Premium
Premium

Premium


Premium


Premium

Premium


Premium


Premium


Premium

Premium


Premium


Premium