
- Home >
- Stock PNGs >
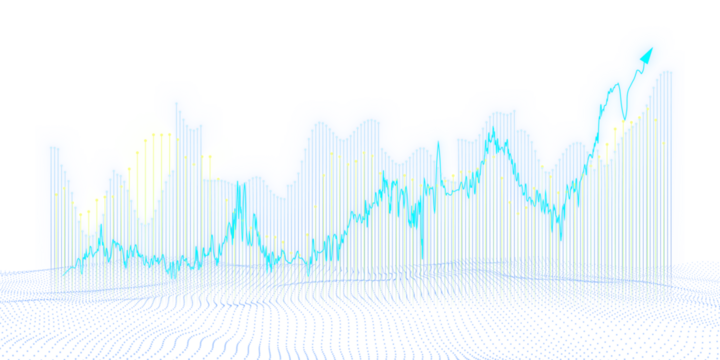
- Line Graph Illustration Transparent with Dots on Grid
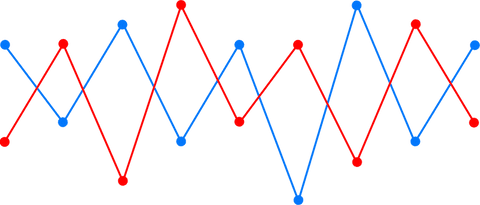
Line Graph Illustration Transparent with Dots on Grid PNG

This illustration features a line graph with dots marking data points, set on a grid pattern. The transparent background makes it versatile for various layouts, like financial reports, presentations, or educational materials. It visually represents data for clear communication regarding trends, performance metrics, or statistical analysis.
Powered by 


downloads
Tags:
More
Credit Photo
If you would like to credit the Photo, here are some ways you can do so
Text Link
png Link
<span class="text-link">
<span>
<a target="_blank" href=https://pikwizard.com/png/line-graph-illustration-transparent-with-dots-on-grid/0c83cc05924aa268739d378506f3f2dd/>PikWizard</a>
</span>
</span>
<span class="image-link">
<span
style="margin: 0 0 20px 0; display: inline-block; vertical-align: middle; width: 100%;"
>
<a
target="_blank"
href="https://pikwizard.com/png/line-graph-illustration-transparent-with-dots-on-grid/0c83cc05924aa268739d378506f3f2dd/"
style="text-decoration: none; font-size: 10px; margin: 0;"
>
<img src="https://pikwizard.com/pw/medium/0c83cc05924aa268739d378506f3f2dd.png" style="margin: 0; width: 100%;" alt="" />
<p style="font-size: 12px; margin: 0;">PikWizard</p>
</a>
</span>
</span>
Free (free of charge)
Free for personal and commercial use.
Author: Awesome Content
Similar Free PNG Images With Transparent Background
Loading...


Premium


Premium


Premium


Premium


Premium


Premium


Premium


Premium


Premium


Premium


Premium


Premium


Premium


Premium


Premium


Premium

Premium


Premium


Premium


Premium


Premium


Premium


Premium


Premium


Premium

Explore More Free PNGs