
- Home >
- Stock PNGs >
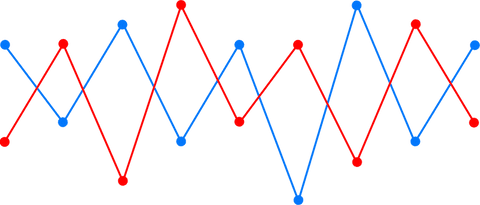
- Pink Statistic Line Chart on Transparent Grid Background
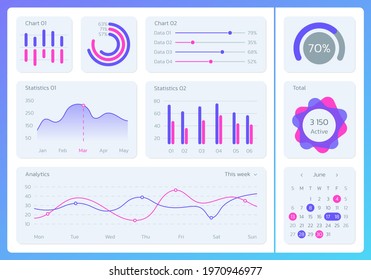
Pink Statistic Line Chart on Transparent Grid Background PNG

Pink line graph presented on transparent grid, offering a modern and eye-catching design. Ideal for use in economic reports, business presentations, or educational materials, adding visual interest and highlighting trends. Adaptable for both print and digital mediums.
Powered by  - Get 15% off with code: PIKWIZARD15


downloads
Tags:
More
Credit Photo
If you would like to credit the Photo, here are some ways you can do so
Text Link
png Link
<span class="text-link">
<span>
<a target="_blank" href=https://pikwizard.com/png/pink-statistic-line-chart-on-transparent-grid-background/e8e52b220ee283c045d17ad0e4e758b4/>PikWizard</a>
</span>
</span>
<span class="image-link">
<span
style="margin: 0 0 20px 0; display: inline-block; vertical-align: middle; width: 100%;"
>
<a
target="_blank"
href="https://pikwizard.com/png/pink-statistic-line-chart-on-transparent-grid-background/e8e52b220ee283c045d17ad0e4e758b4/"
style="text-decoration: none; font-size: 10px; margin: 0;"
>
<img src="https://pikwizard.com/pw/medium/e8e52b220ee283c045d17ad0e4e758b4.png" style="margin: 0; width: 100%;" alt="" />
<p style="font-size: 12px; margin: 0;">PikWizard</p>
</a>
</span>
</span>
Free (free of charge)
Free for personal and commercial use.
Author: Awesome Content
Similar Free PNG Images With Transparent Background


Premium


Premium


Premium


Premium

Premium


Premium


Premium

Premium
Premium


Premium


Premium

Premium


Premium


Premium


Premium


Premium


Premium


Premium


Premium


Premium


Premium


Premium
Premium


Premium
Premium


Explore More Free PNGs