- Home >
- Stock PNGs >
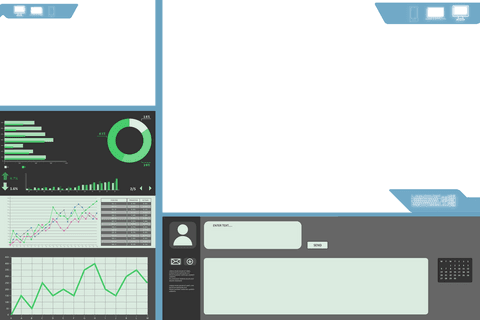
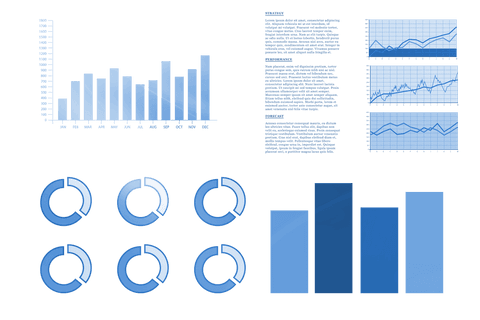
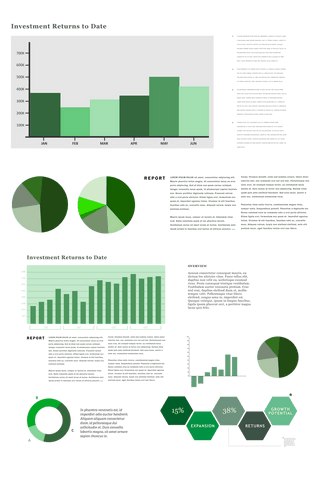
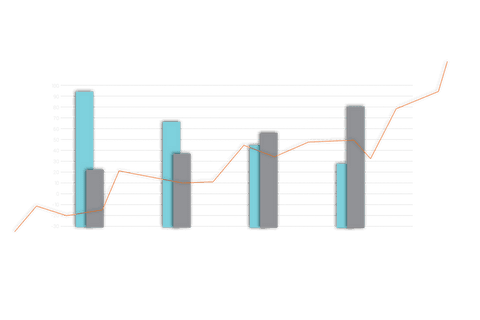
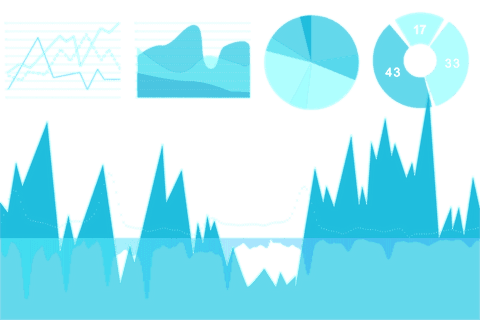
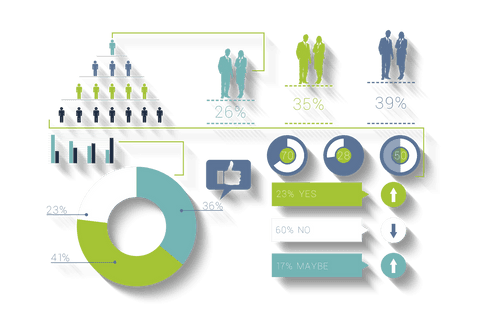
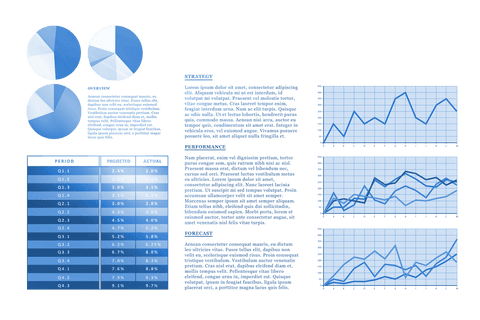
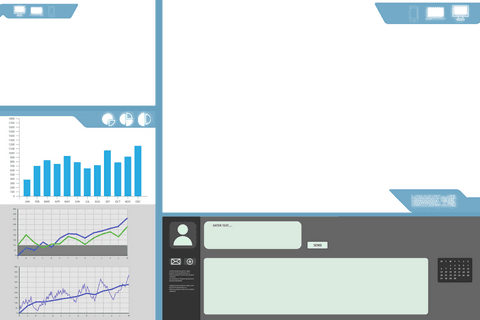
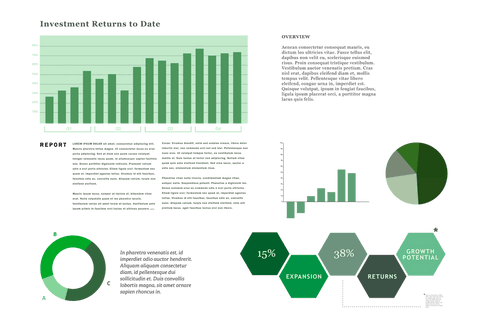
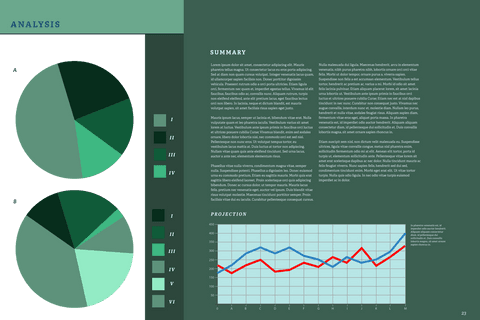
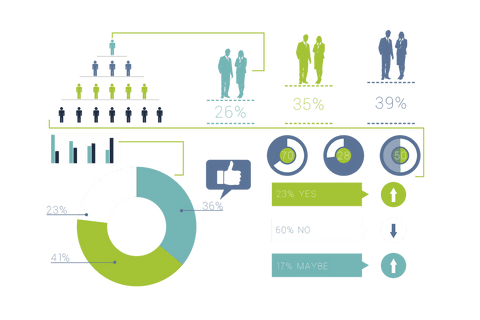
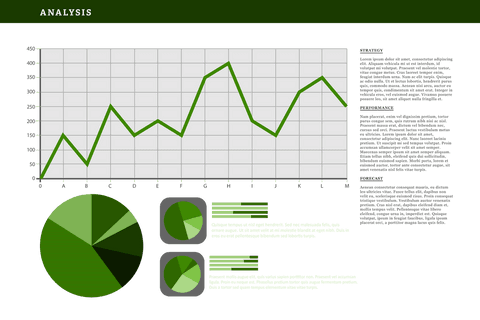
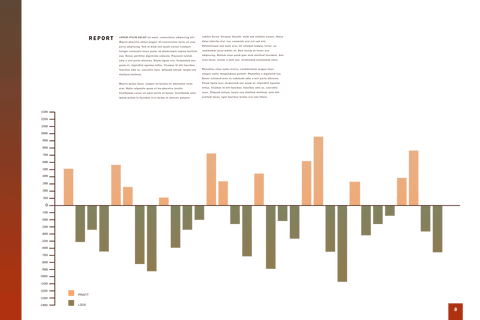
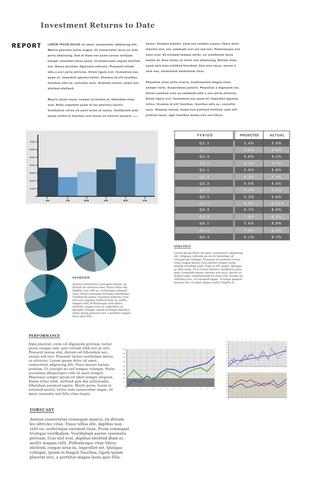
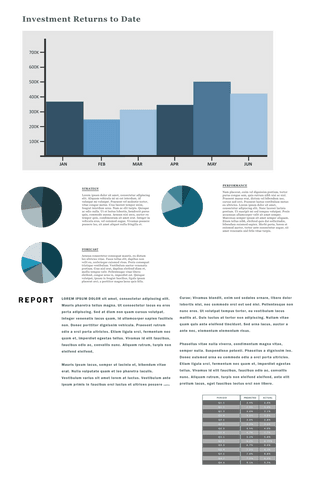
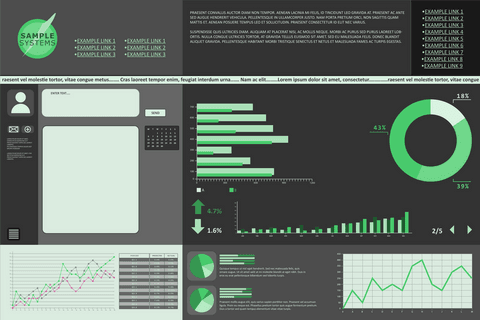
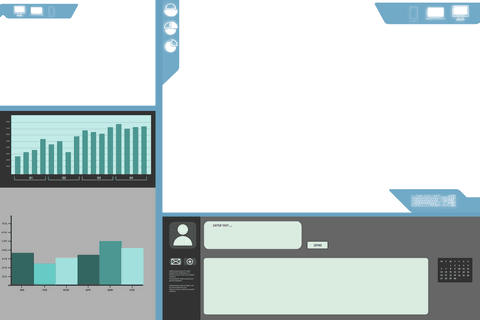
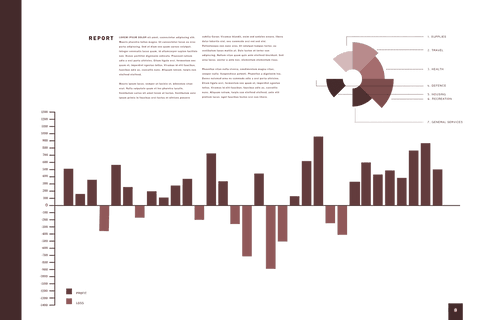
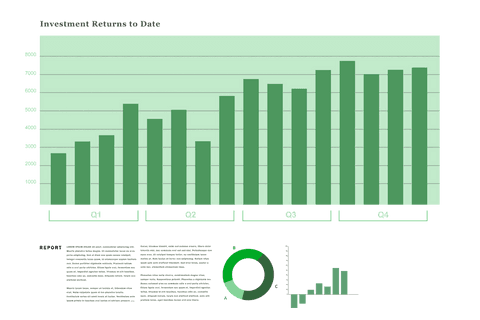
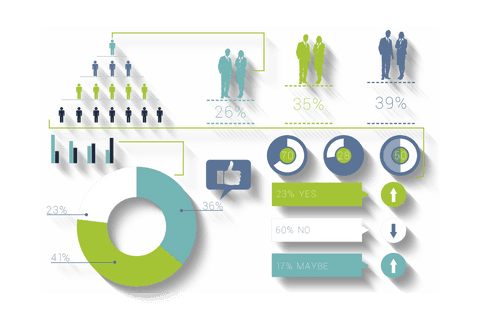
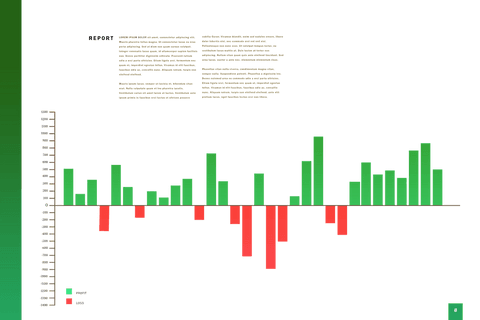
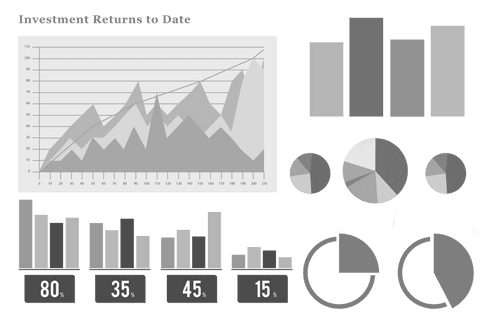
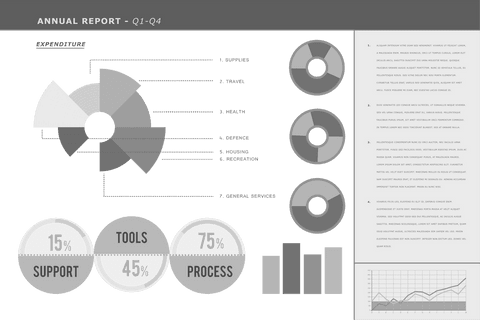
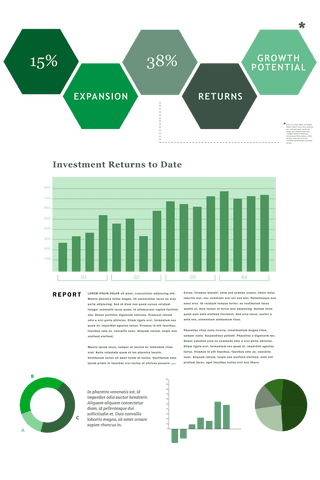
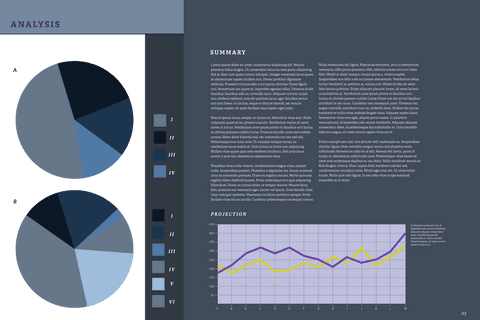
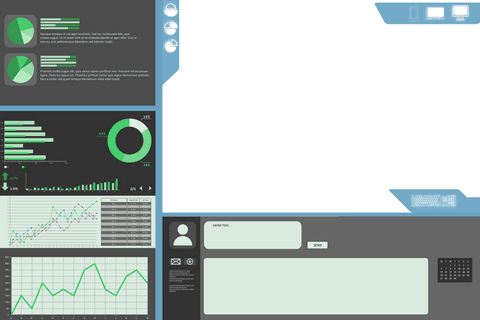
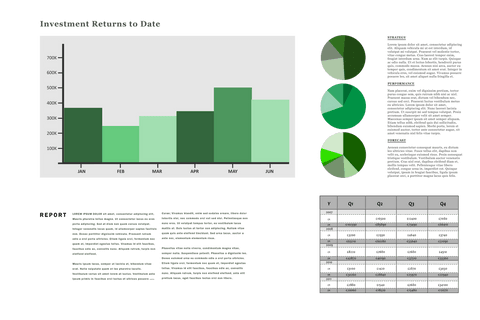
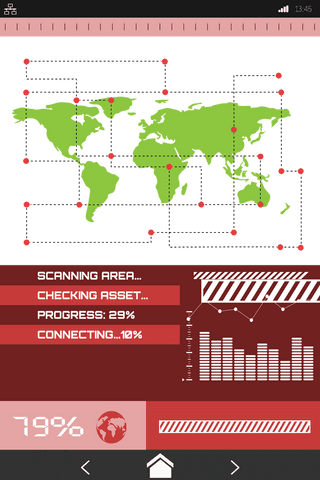
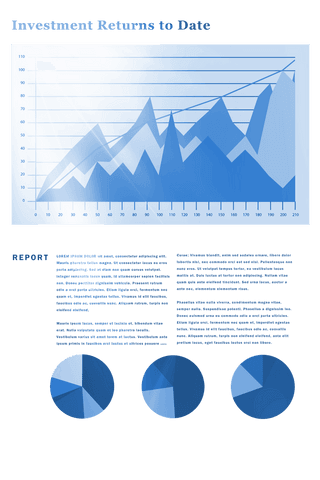
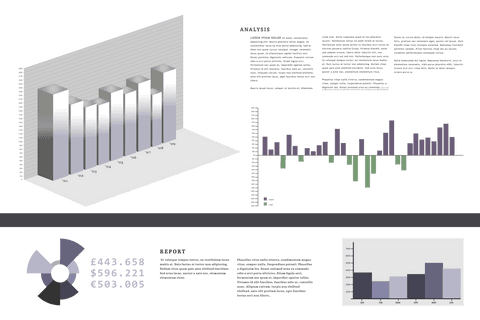
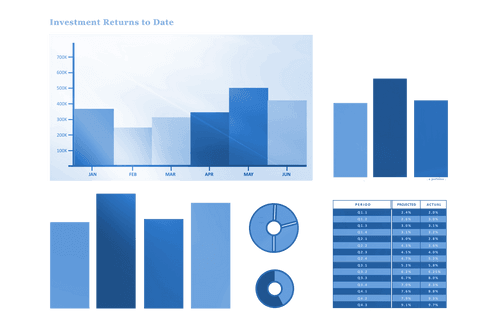
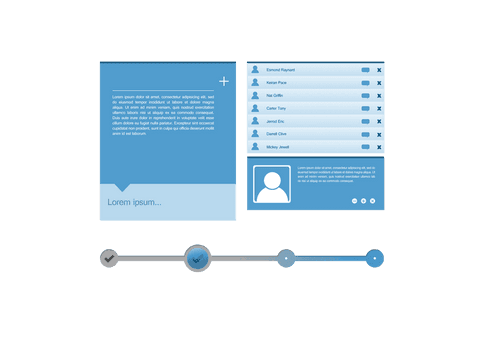
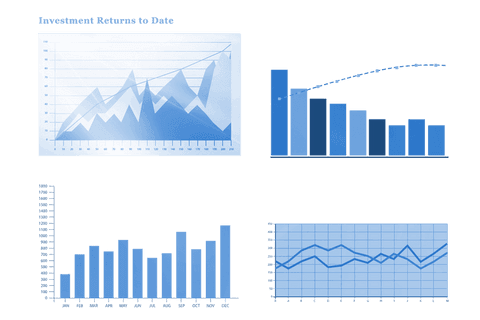
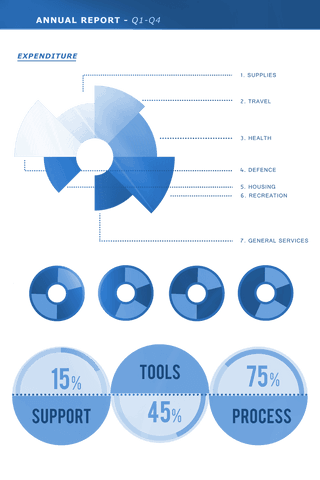
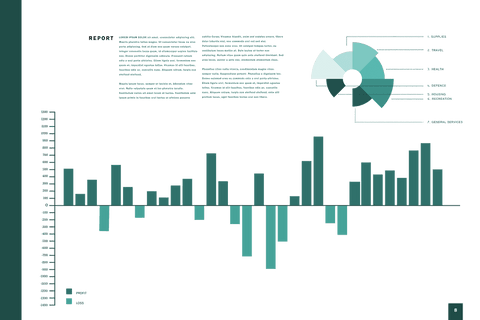
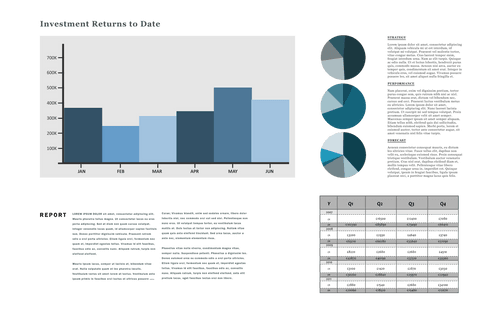
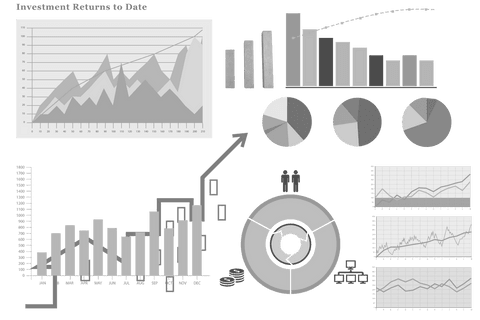
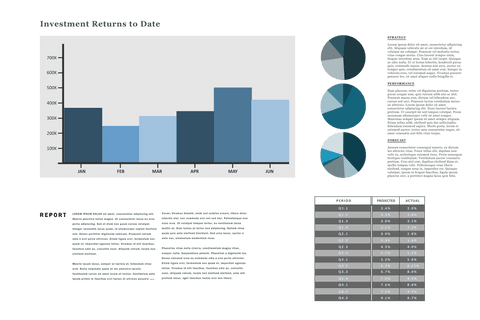
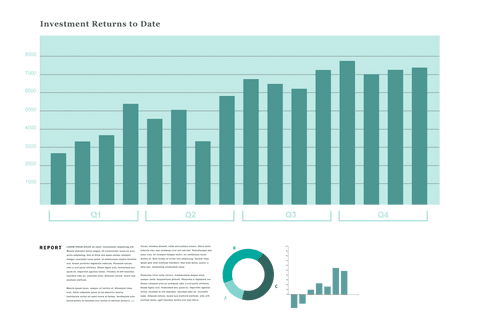
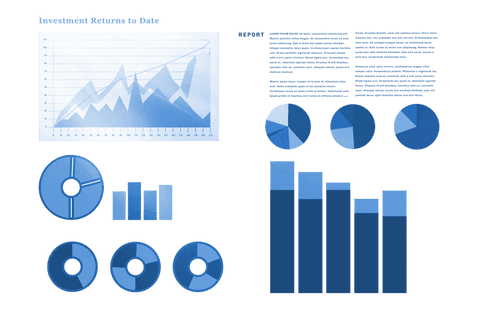
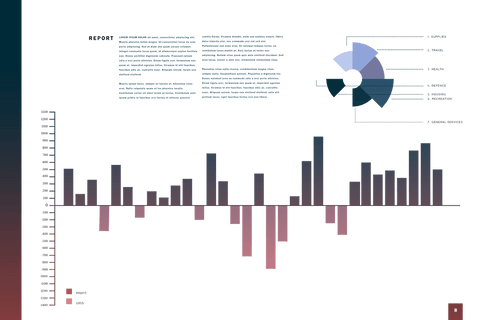
- Purple Data Analytics Charts on Transparent Background
Purple Data Analytics Charts on Transparent Background PNG
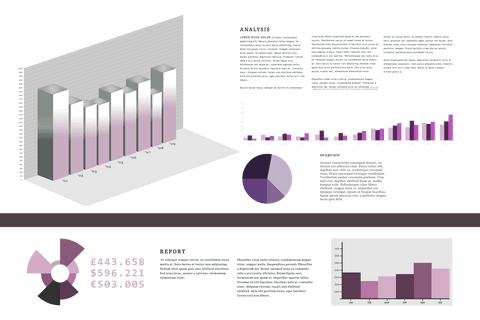
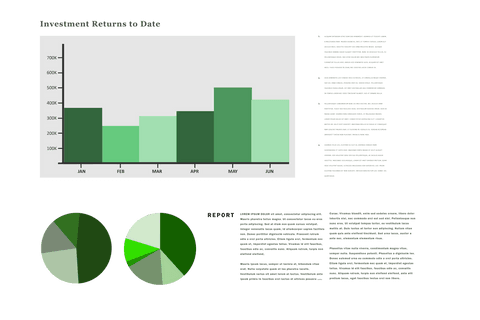
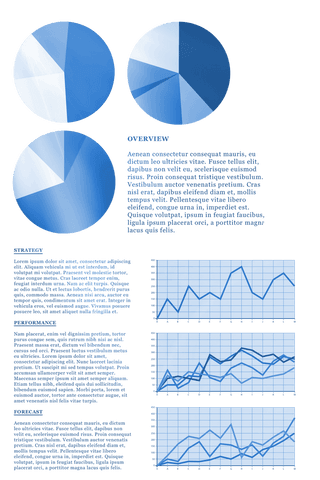
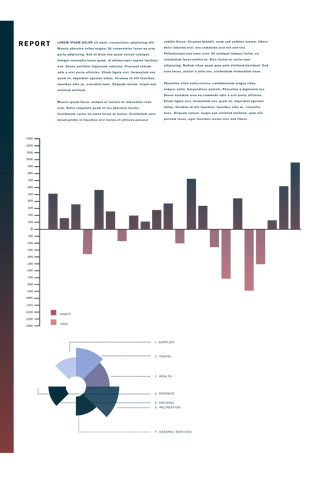
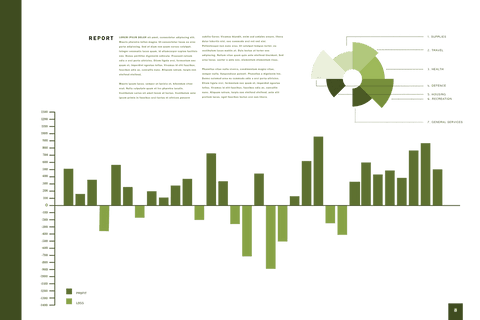
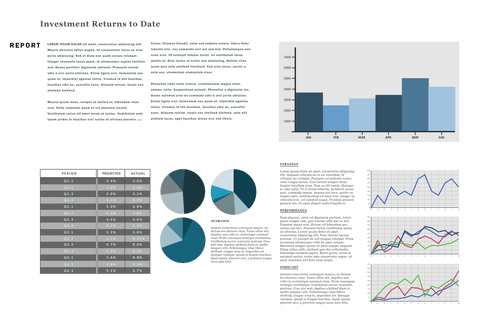
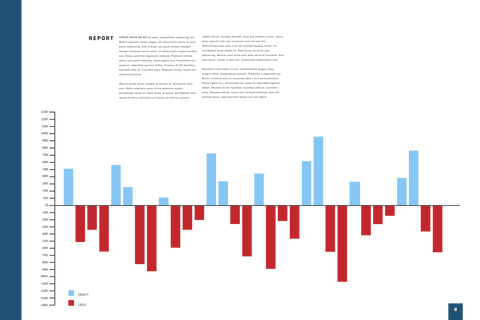
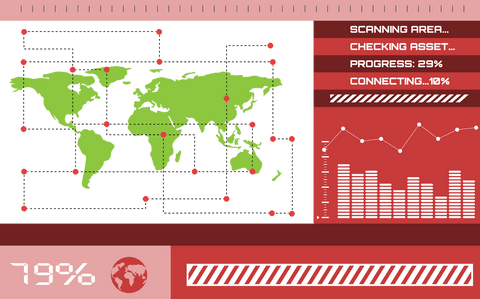
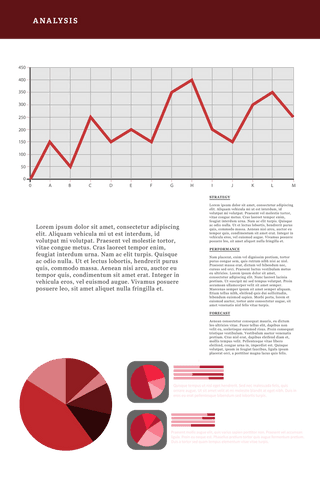
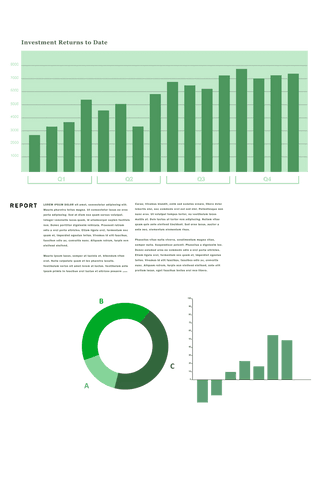
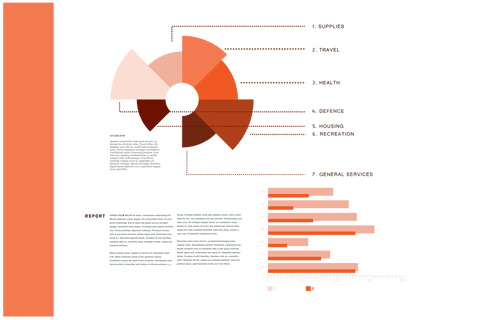
This illustration presents various graphs and charts in purple tones on a transparent background, designed as a vector style ideal for business and data presentations. Useful for infographics and financial reports, ideal to add visually appealing statistical representations to marketing documents.

downloads
Tags:
More
Credit Photo
If you would like to credit the Photo, here are some ways you can do so
Text Link
png Link
<span class="text-link">
<span>
<a target="_blank" href=https://pikwizard.com/png/purple-data-analytics-charts-on-transparent-background/169d147e6faec97911b91f70052d36f0/>PikWizard</a>
</span>
</span>
<span class="image-link">
<span
style="margin: 0 0 20px 0; display: inline-block; vertical-align: middle; width: 100%;"
>
<a
target="_blank"
href="https://pikwizard.com/png/purple-data-analytics-charts-on-transparent-background/169d147e6faec97911b91f70052d36f0/"
style="text-decoration: none; font-size: 10px; margin: 0;"
>
<img src="https://pikwizard.com/pw/medium/169d147e6faec97911b91f70052d36f0.png" style="margin: 0; width: 100%;" alt="" />
<p style="font-size: 12px; margin: 0;">PikWizard</p>
</a>
</span>
</span>
Free (free of charge)
Free for personal and commercial use.
Author: Awesome Content