- Home >
- Stock PNGs >
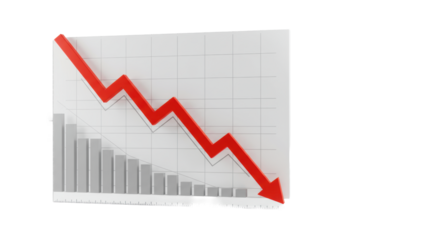
- Red Statistic Line Graph Chart on Transparent Background
Red Statistic Line Graph Chart on Transparent Background PNG

Red line graph on transparent background illustrating statistical fluctuations, useful for finance reports, presentations, and business analysis to depict economic trends and data variations. Ideal for content creators needing customizable graph illustrations in their documents or websites.
downloads
Tags:
More
Credit Photo
If you would like to credit the Photo, here are some ways you can do so
Text Link
png Link
<span class="text-link">
<span>
<a target="_blank" href=https://pikwizard.com/png/red-statistic-line-graph-chart-on-transparent-background/70ebfa702e936e7ac11d5a251ba5c052/>PikWizard</a>
</span>
</span>
<span class="image-link">
<span
style="margin: 0 0 20px 0; display: inline-block; vertical-align: middle; width: 100%;"
>
<a
target="_blank"
href="https://pikwizard.com/png/red-statistic-line-graph-chart-on-transparent-background/70ebfa702e936e7ac11d5a251ba5c052/"
style="text-decoration: none; font-size: 10px; margin: 0;"
>
<img src="https://pikwizard.com/pw/medium/70ebfa702e936e7ac11d5a251ba5c052.png" style="margin: 0; width: 100%;" alt="" />
<p style="font-size: 12px; margin: 0;">PikWizard</p>
</a>
</span>
</span>
Free (free of charge)
Free for personal and commercial use.
Author: Awesome Content


