
- Home >
- Stock PNGs >
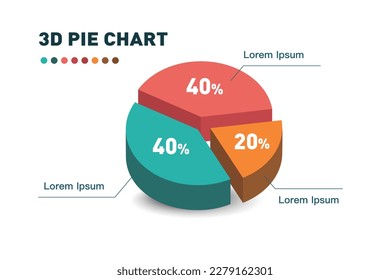
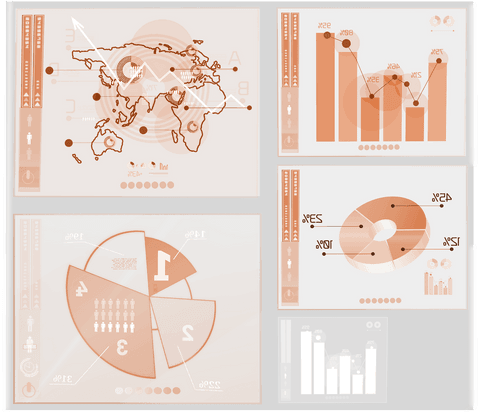
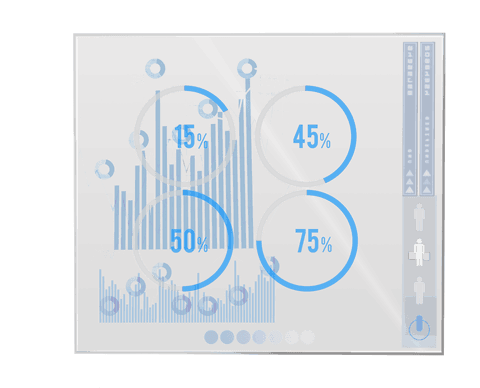
- Transparent 3D Pie Chart with Interactive Elements
Transparent 3D Pie Chart with Interactive Elements PNG
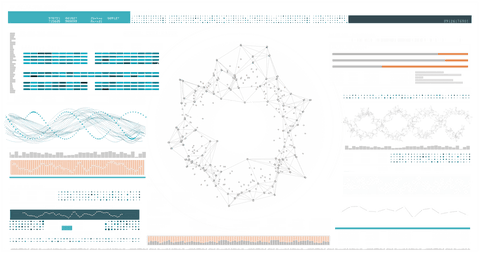
High-quality illustration of a transparent, 3D pie chart accented with interactive elements such as volume controls and levels adjusting interface. This visualization showcases data presentation with a modern technical feel, perfect for educational materials, tech business presentations, and data analytics reports.
Powered by  - Get 15% off with code: PIKWIZARD15


downloads
Tags:
More
Credit Photo
If you would like to credit the Photo, here are some ways you can do so
Text Link
png Link
<span class="text-link">
<span>
<a target="_blank" href=https://pikwizard.com/png/transparent-3d-pie-chart-with-interactive-elements/d9ecab4fb6b2bb8afbb730dd27c42fe8/>PikWizard</a>
</span>
</span>
<span class="image-link">
<span
style="margin: 0 0 20px 0; display: inline-block; vertical-align: middle; width: 100%;"
>
<a
target="_blank"
href="https://pikwizard.com/png/transparent-3d-pie-chart-with-interactive-elements/d9ecab4fb6b2bb8afbb730dd27c42fe8/"
style="text-decoration: none; font-size: 10px; margin: 0;"
>
<img src="https://pikwizard.com/pw/medium/d9ecab4fb6b2bb8afbb730dd27c42fe8.png" style="margin: 0; width: 100%;" alt="" />
<p style="font-size: 12px; margin: 0;">PikWizard</p>
</a>
</span>
</span>
Free (free of charge)
Free for personal and commercial use.
Author: Authentic Images
Similar Free PNG Images With Transparent Background


Premium
Premium


Premium


Premium


Premium


Premium


Premium


Premium


Premium


Premium


Premium

Premium

Premium

Explore More Free PNGs