- Home >
- Stock PNGs >
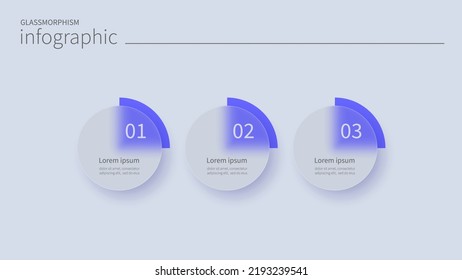
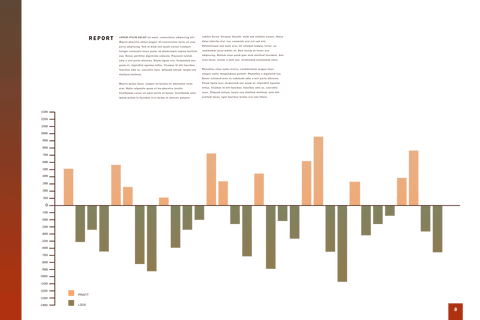
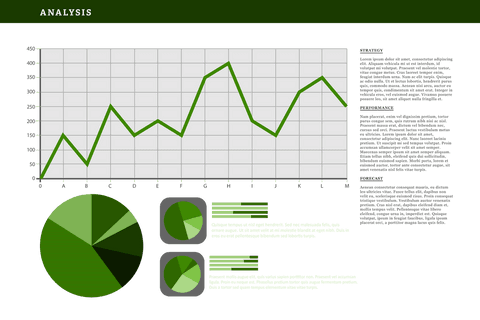
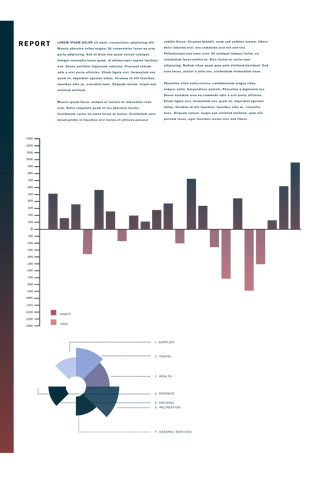
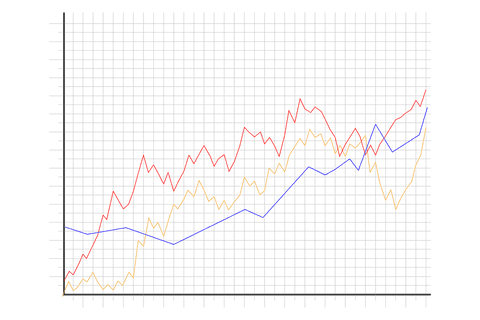
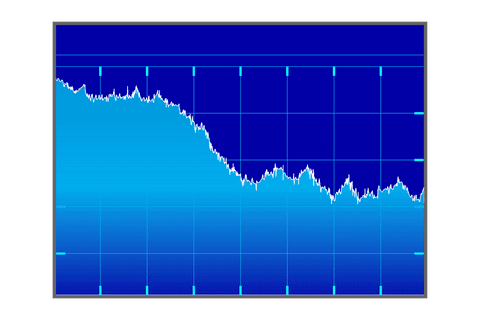
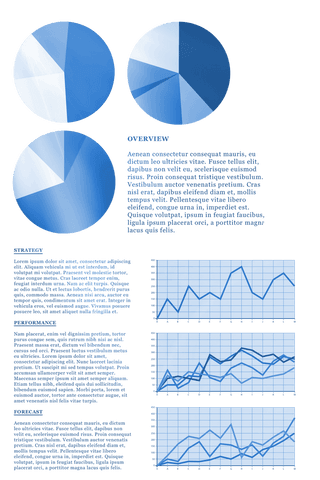
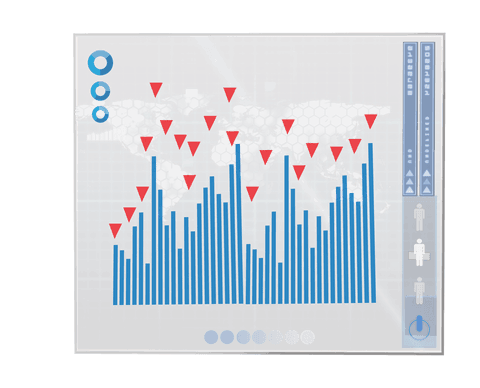
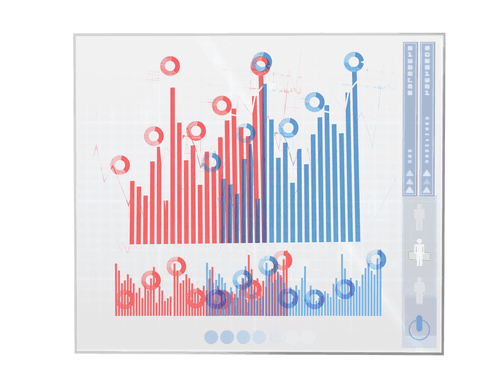
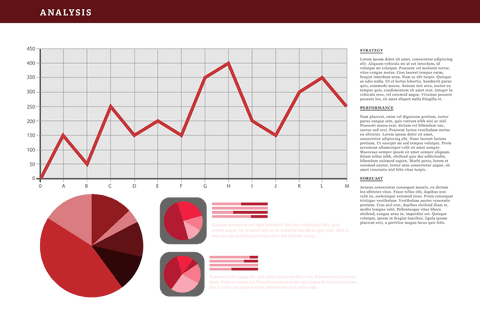
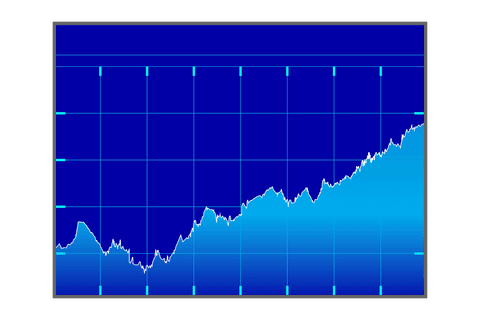
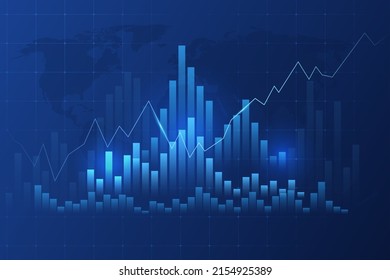
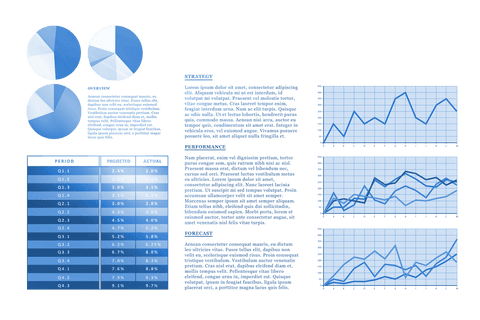
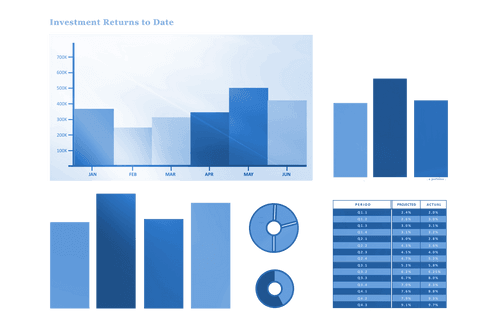
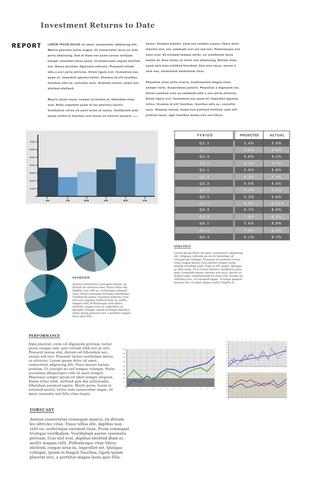
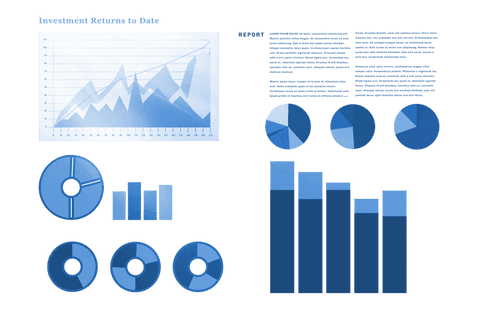
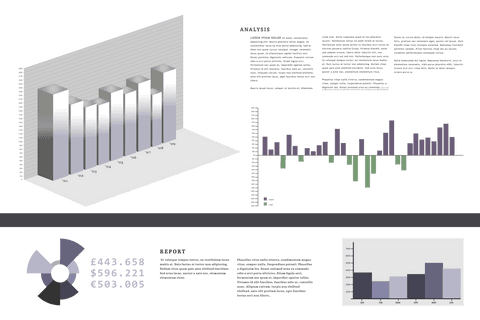
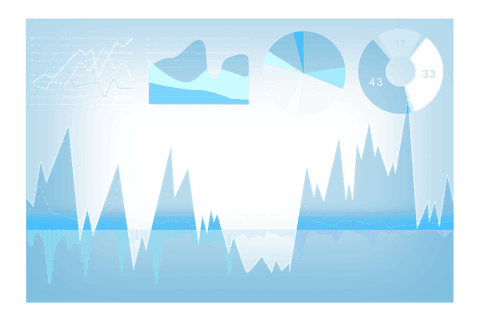
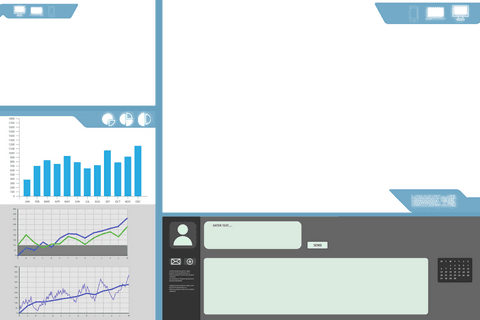
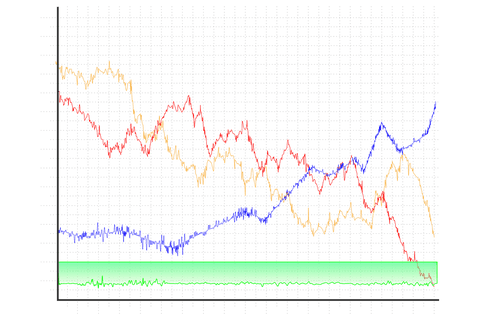
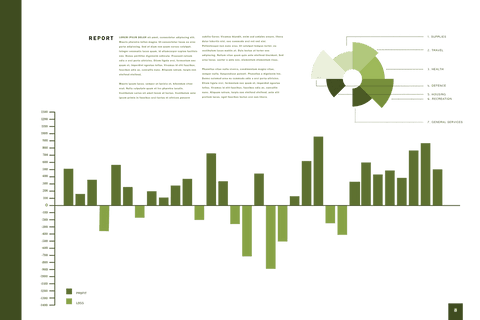
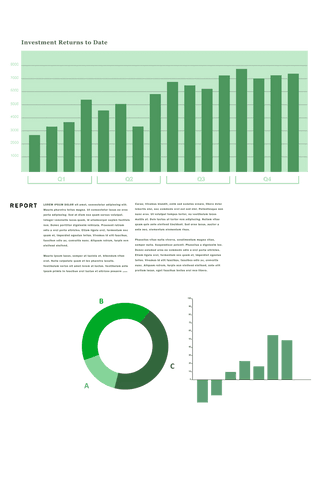
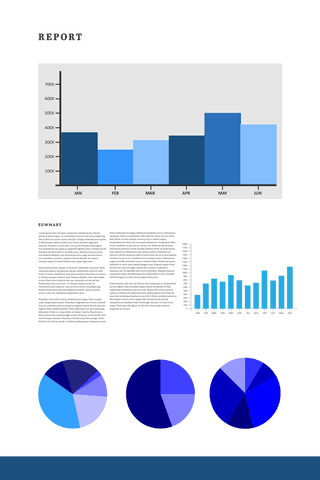
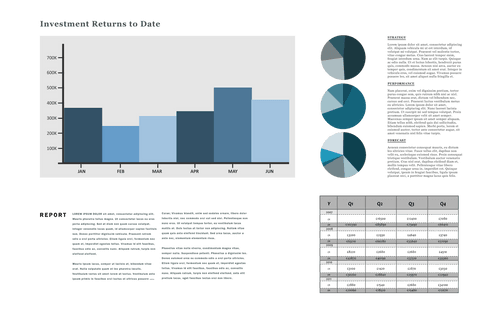
- Transparent Background Blue Chart Diagrams Vector for Business
Transparent Background Blue Chart Diagrams Vector for Business PNG
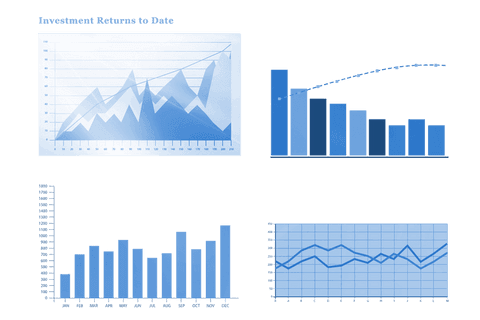
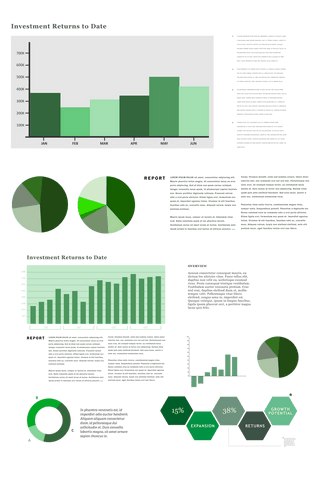
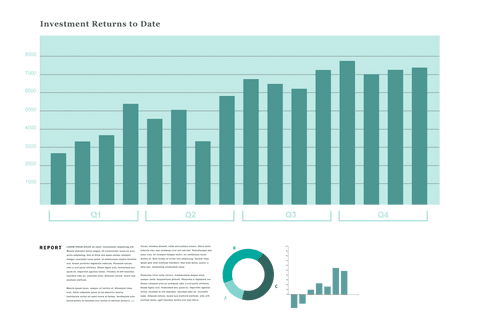
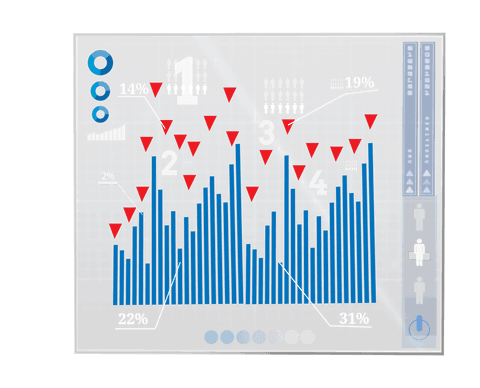
This vector illustration features varied chart diagrams in blue tones on a transparent background, ideal for business and economy-related projects. Use it in presentations, analysis reports, and financial forecasts to effectively communicate data. The transparent background allows easy integration into diverse media formats.
Powered by  - Get 15% off with code: PIKWIZARD15


1
downloads
downloads
Tags:
More
Credit Photo
If you would like to credit the Photo, here are some ways you can do so
Text Link
png Link
<span class="text-link">
<span>
<a target="_blank" href=https://pikwizard.com/png/transparent-background-blue-chart-diagrams-vector-for-business/44fb6a27632bd6a10ba7c388b8f53c9f/>PikWizard</a>
</span>
</span>
<span class="image-link">
<span
style="margin: 0 0 20px 0; display: inline-block; vertical-align: middle; width: 100%;"
>
<a
target="_blank"
href="https://pikwizard.com/png/transparent-background-blue-chart-diagrams-vector-for-business/44fb6a27632bd6a10ba7c388b8f53c9f/"
style="text-decoration: none; font-size: 10px; margin: 0;"
>
<img src="https://pikwizard.com/pw/medium/44fb6a27632bd6a10ba7c388b8f53c9f.png" style="margin: 0; width: 100%;" alt="" />
<p style="font-size: 12px; margin: 0;">PikWizard</p>
</a>
</span>
</span>
Free (free of charge)
Free for personal and commercial use.
Author: Creative Art
Similar Free PNG Images With Transparent Background
Loading...
Premium


Premium


Premium

Premium

Premium


Premium

Premium

Premium
Premium
Premium


Premium


Premium


Premium


Premium


Premium


Premium


Premium


Premium


Premium


Premium


Premium

Premium


Premium


Premium


Premium