- Home >
- Stock PNGs >
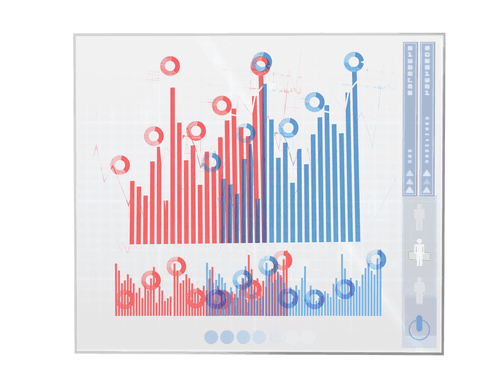
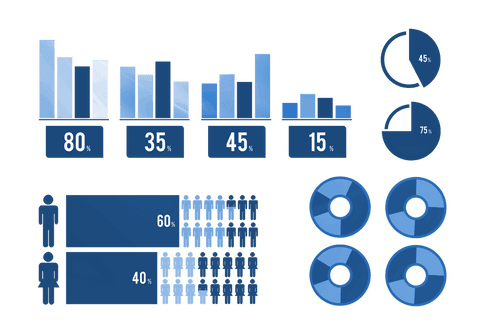
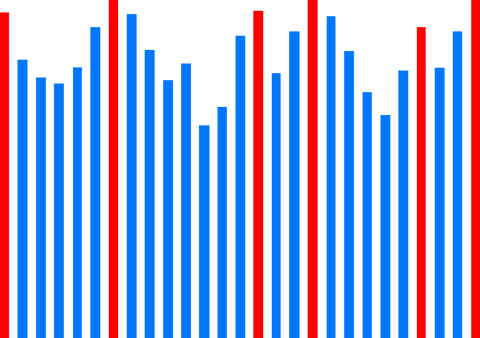
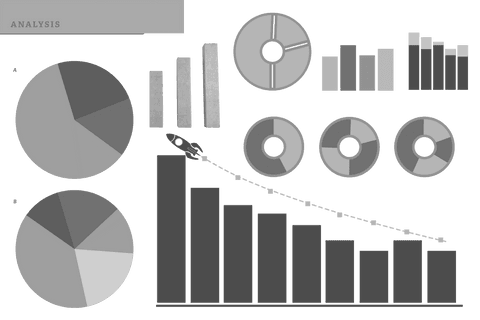
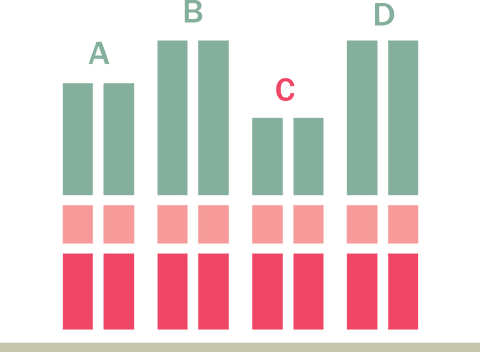
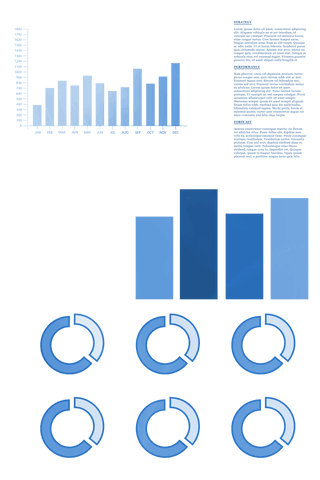
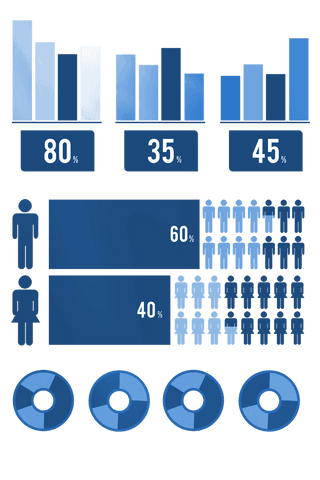
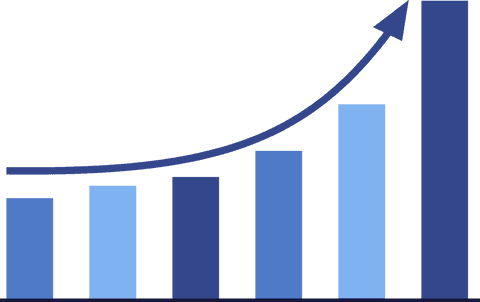
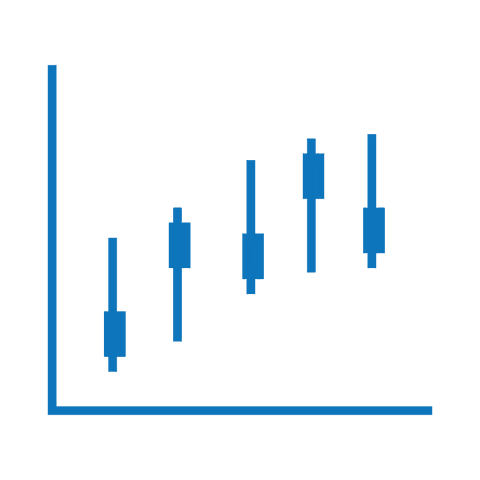
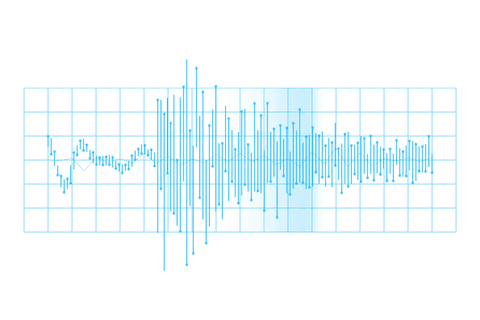
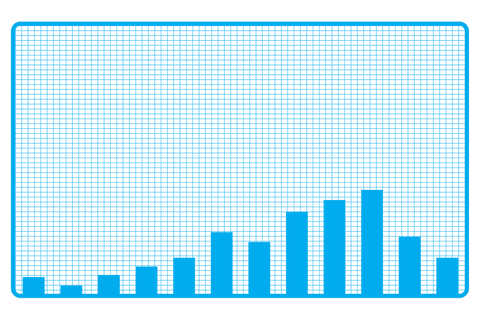
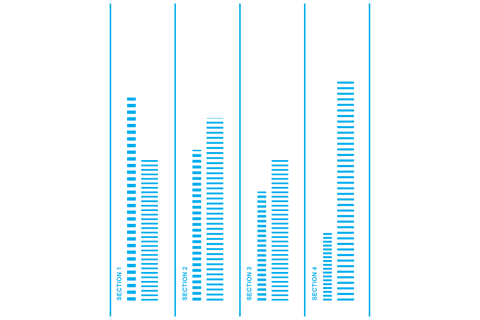
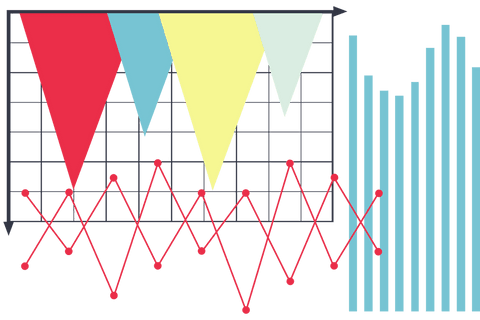
- Transparent Bar Graph Illustration with Segmented Columns
Transparent Bar Graph Illustration with Segmented Columns PNG
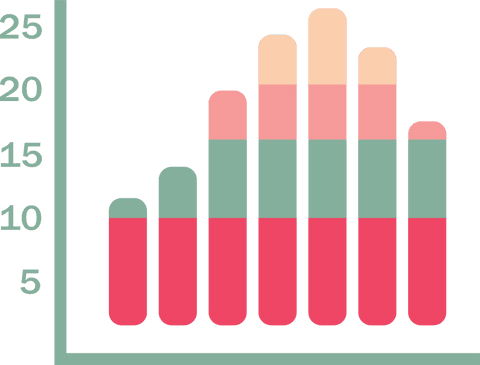
This transparent vector illustration features a bar graph with segmented columns, showcasing different color sections and a cartesian scale on the left. It is perfect for presentations, reports, and educational materials focusing on business analysis, data comparisons, and statistical visualizations. Useful for enhancing Infographics on financial growth, market trends, or academic use.
Powered by 


Credit Photo
If you would like to credit the Photo, here are some ways you can do so
Text Link
png Link
<span class="text-link">
<span>
<a target="_blank" href=https://pikwizard.com/png/transparent-bar-graph-illustration-with-segmented-columns/1cc90994c237c51823adff9ede34c0e4/>PikWizard</a>
</span>
</span>
<span class="image-link">
<span
style="margin: 0 0 20px 0; display: inline-block; vertical-align: middle; width: 100%;"
>
<a
target="_blank"
href="https://pikwizard.com/png/transparent-bar-graph-illustration-with-segmented-columns/1cc90994c237c51823adff9ede34c0e4/"
style="text-decoration: none; font-size: 10px; margin: 0;"
>
<img src="https://pikwizard.com/pw/medium/1cc90994c237c51823adff9ede34c0e4.png" style="margin: 0; width: 100%;" alt="" />
<p style="font-size: 12px; margin: 0;">PikWizard</p>
</a>
</span>
</span>
Free (free of charge)
Free for personal and commercial use.
Author: Authentic Images