
- Home >
- Stock PNGs >
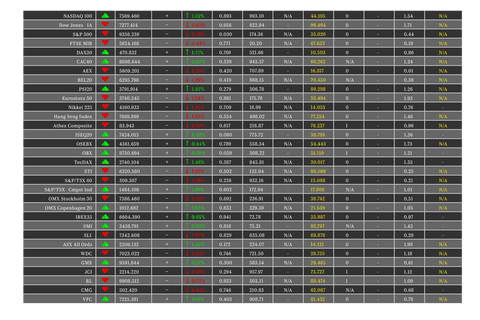
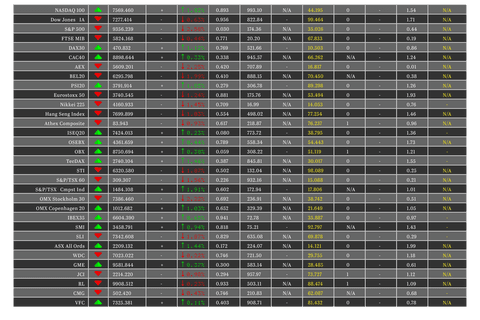
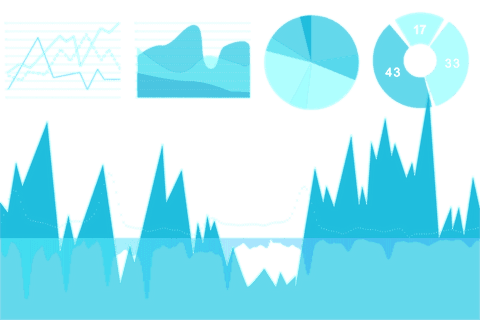
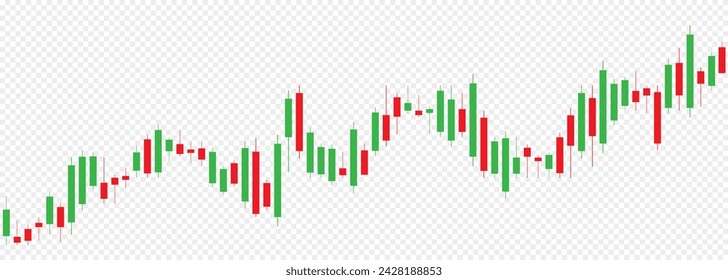
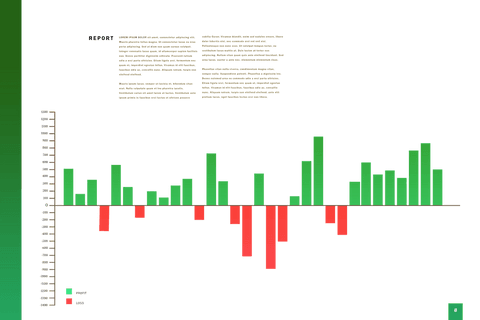
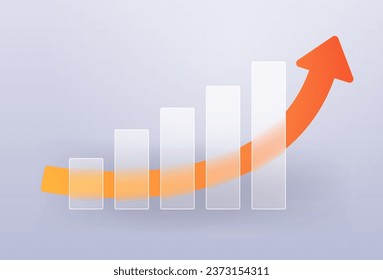
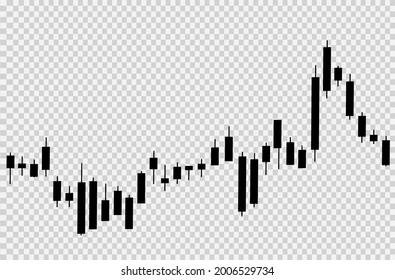
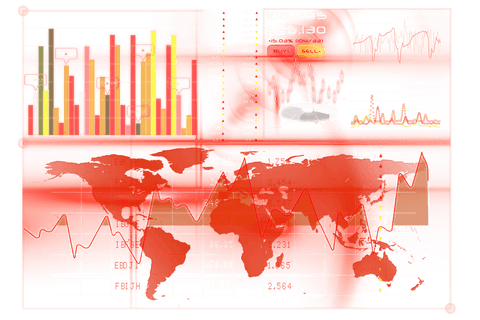
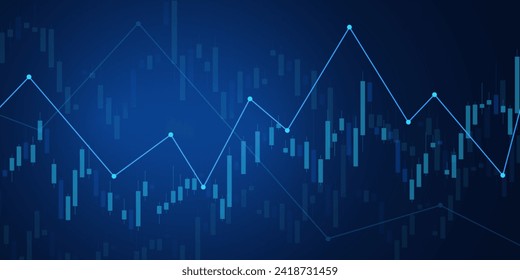
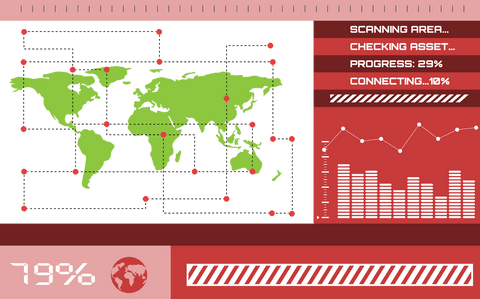
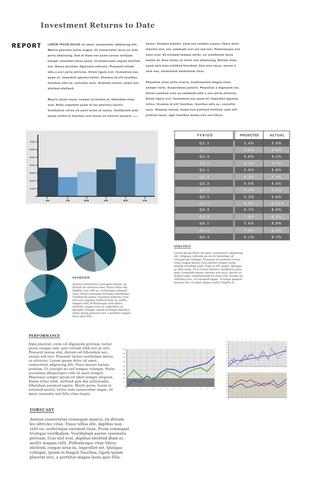
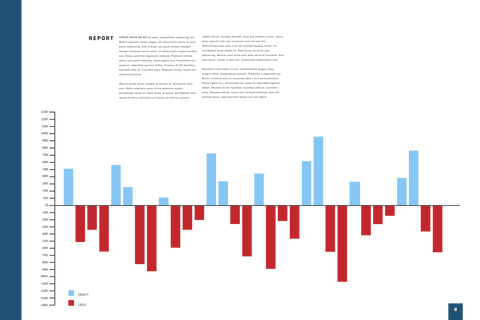
- Transparent Bar Graph with Downward Trend Line
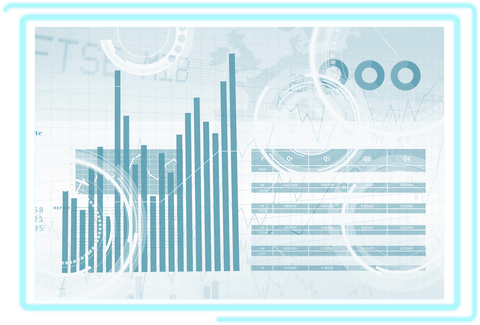
Transparent Bar Graph with Downward Trend Line PNG
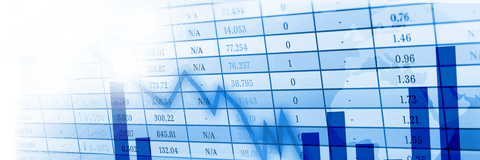
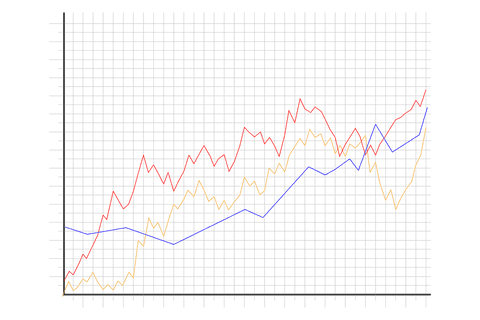
Chart diagram features financial statistics with bar graph indicating downward trend. Suitable for illustrating economic downtrend, stock market analysis, business reports, and financial reviews.
Powered by  - Get 15% off with code: PIKWIZARD15


downloads
Tags:
More
Credit Photo
If you would like to credit the Photo, here are some ways you can do so
Text Link
png Link
<span class="text-link">
<span>
<a target="_blank" href=https://pikwizard.com/png/transparent-bar-graph-with-downward-trend-line/36cf1fb9b2ccc0eefd336c13d3ae2fe2/>PikWizard</a>
</span>
</span>
<span class="image-link">
<span
style="margin: 0 0 20px 0; display: inline-block; vertical-align: middle; width: 100%;"
>
<a
target="_blank"
href="https://pikwizard.com/png/transparent-bar-graph-with-downward-trend-line/36cf1fb9b2ccc0eefd336c13d3ae2fe2/"
style="text-decoration: none; font-size: 10px; margin: 0;"
>
<img src="https://pikwizard.com/pw/medium/36cf1fb9b2ccc0eefd336c13d3ae2fe2.png" style="margin: 0; width: 100%;" alt="" />
<p style="font-size: 12px; margin: 0;">PikWizard</p>
</a>
</span>
</span>
Free (free of charge)
Free for personal and commercial use.
Author: Authentic Images
Similar Free PNG Images With Transparent Background


Premium


Premium

Premium


Premium
Premium


Premium


Premium

Premium
Premium


Premium


Premium
Premium

Premium

Premium


Premium


Premium

Premium


Premium

Premium


Premium


Premium

Premium


Premium


Premium
Premium


Explore More Free PNGs