- Home >
- Stock PNGs >
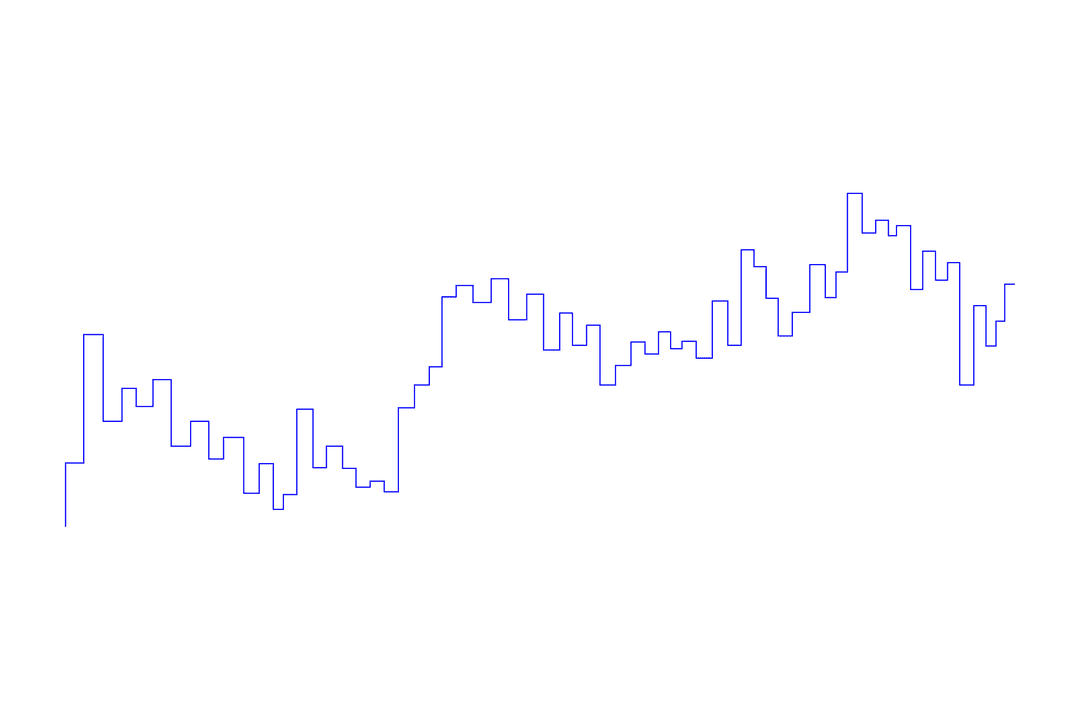
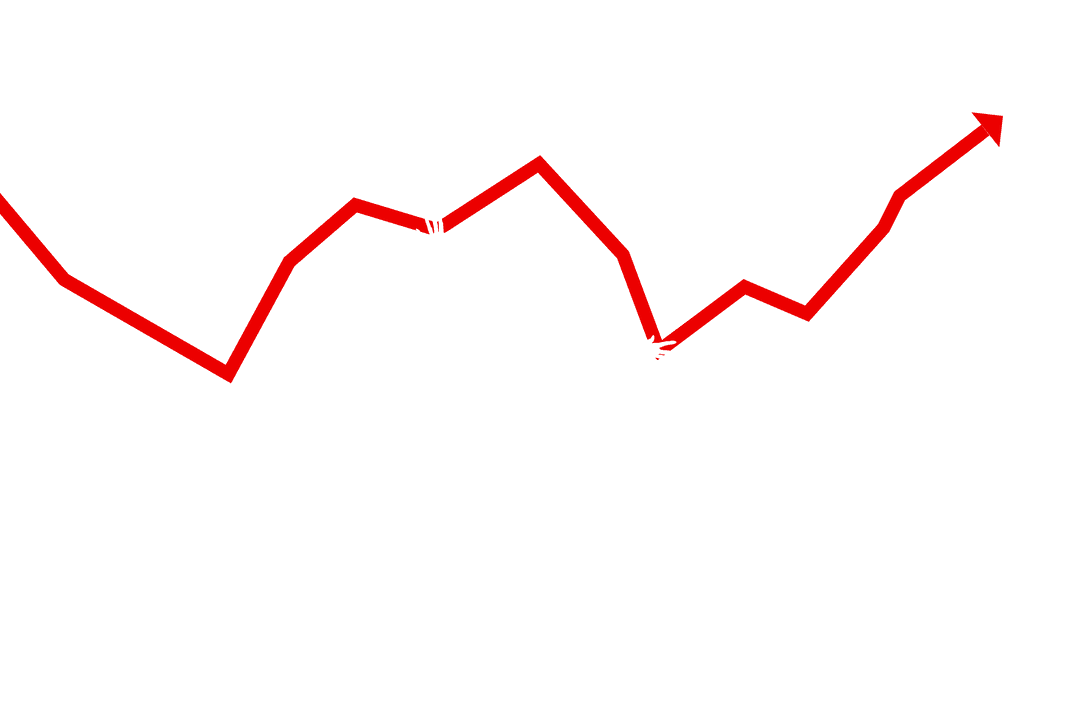
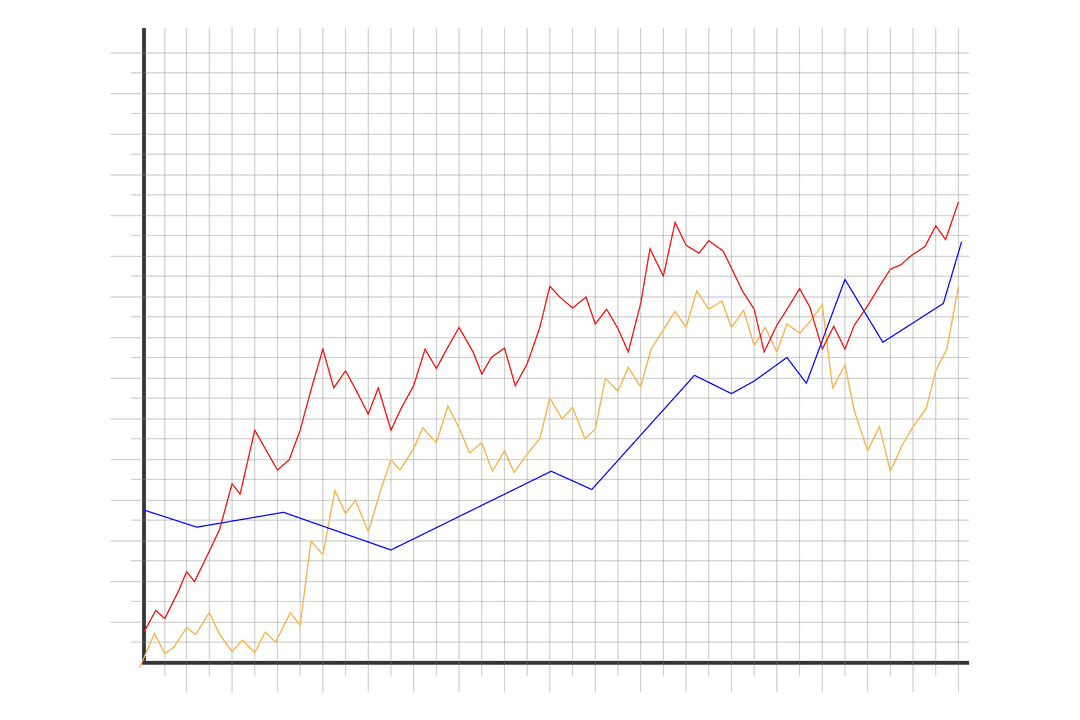
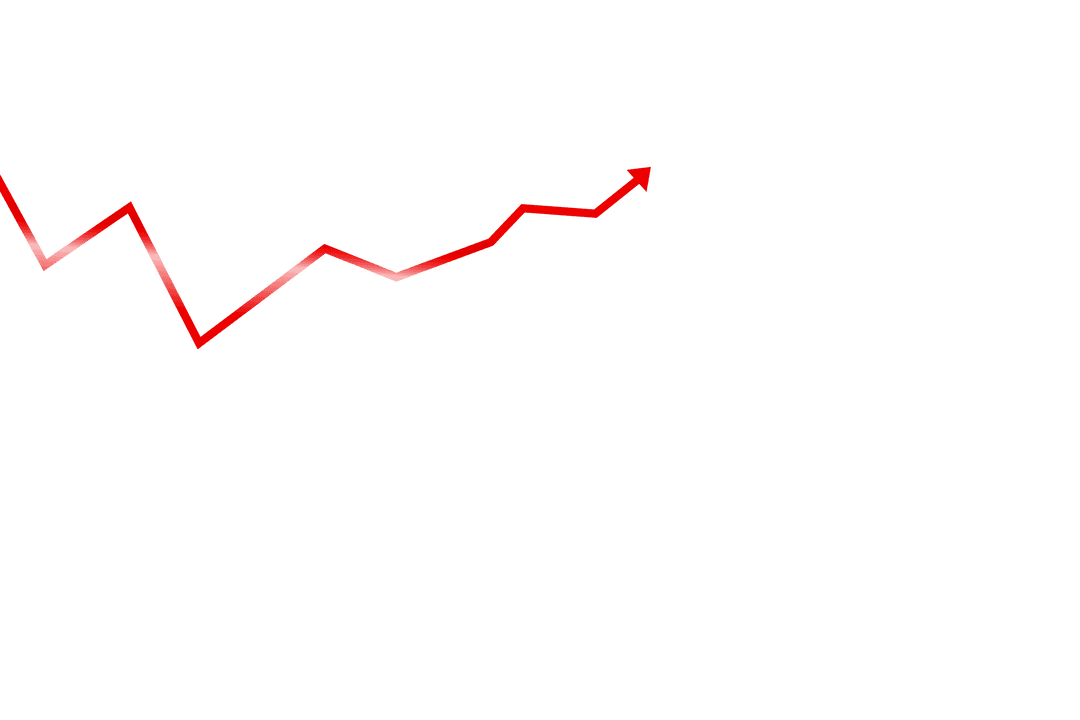
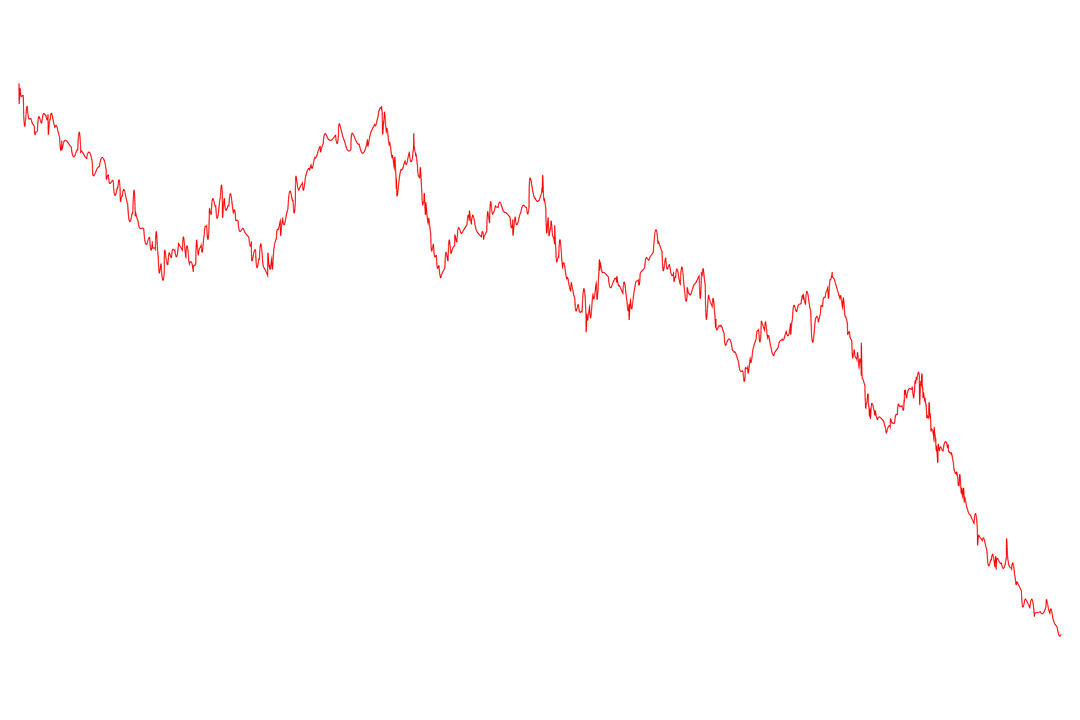
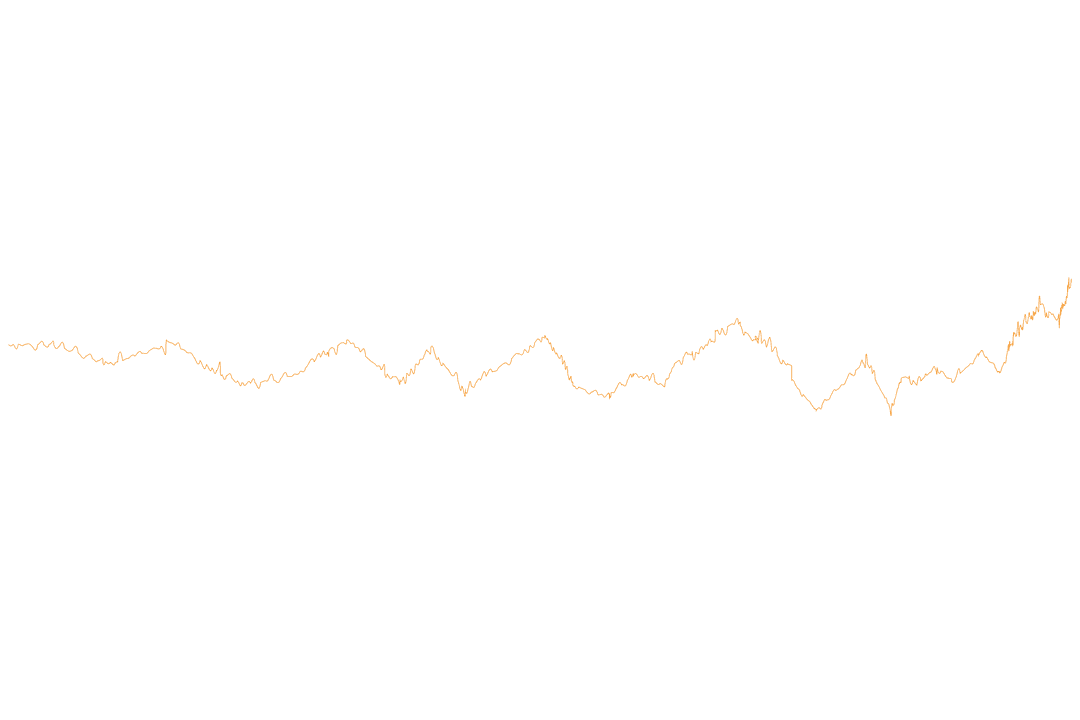
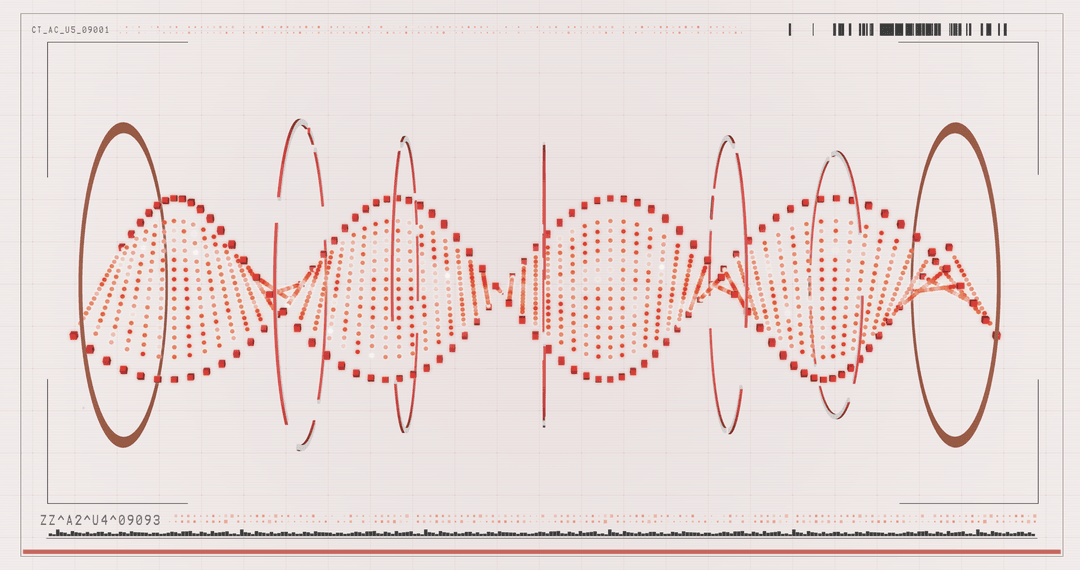
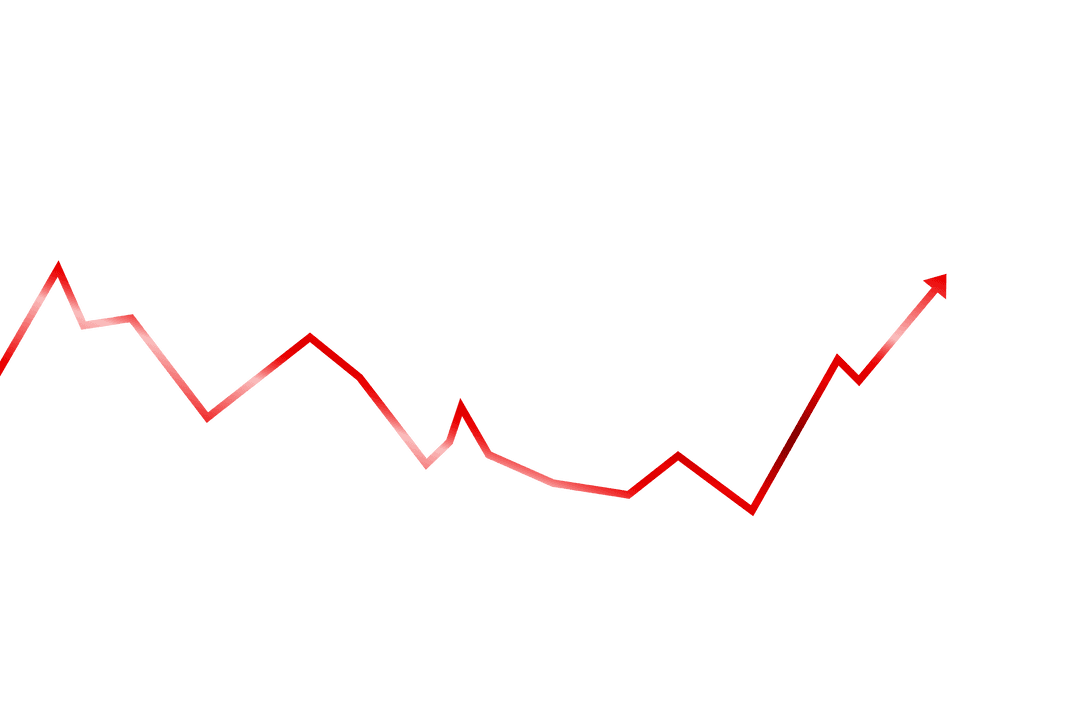
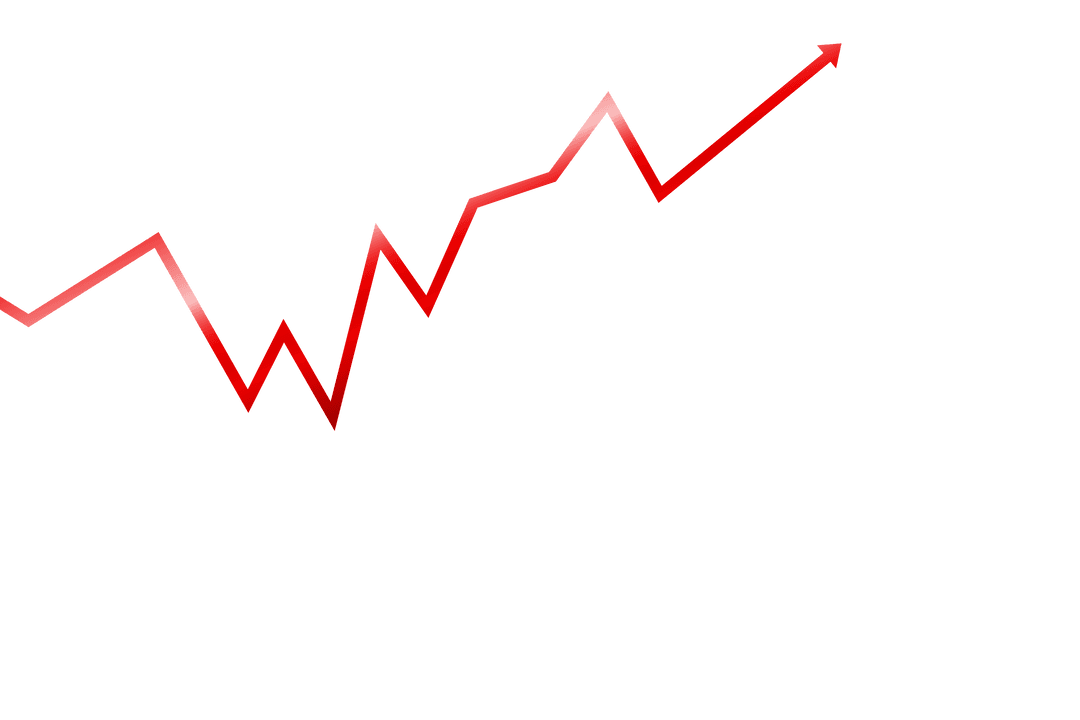
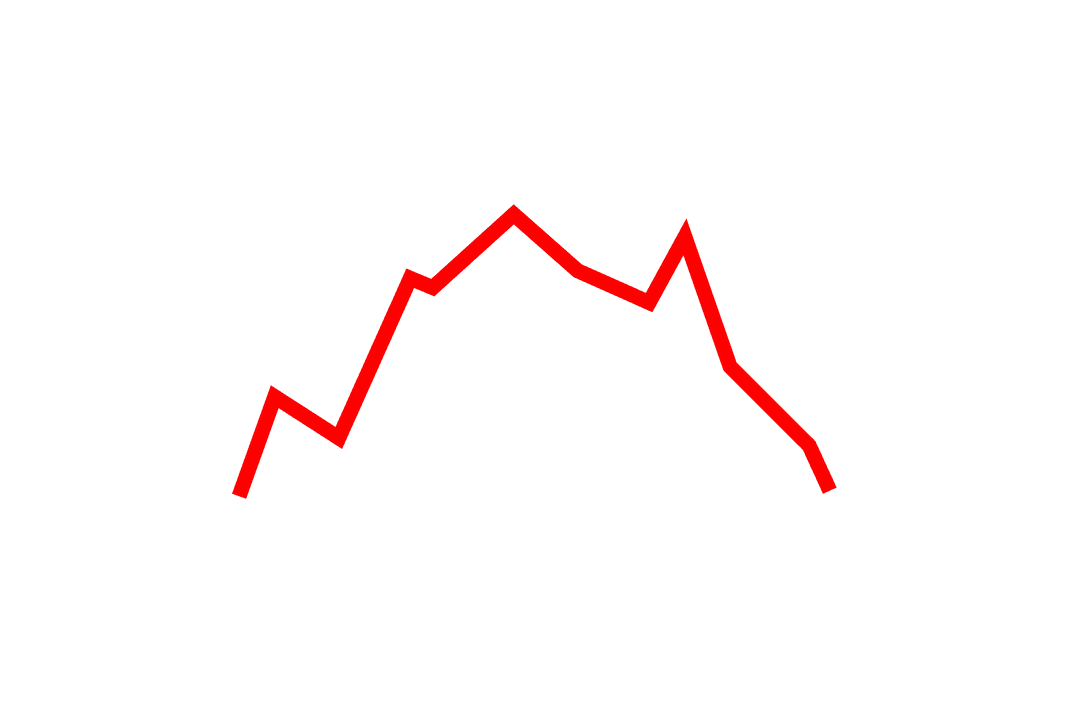
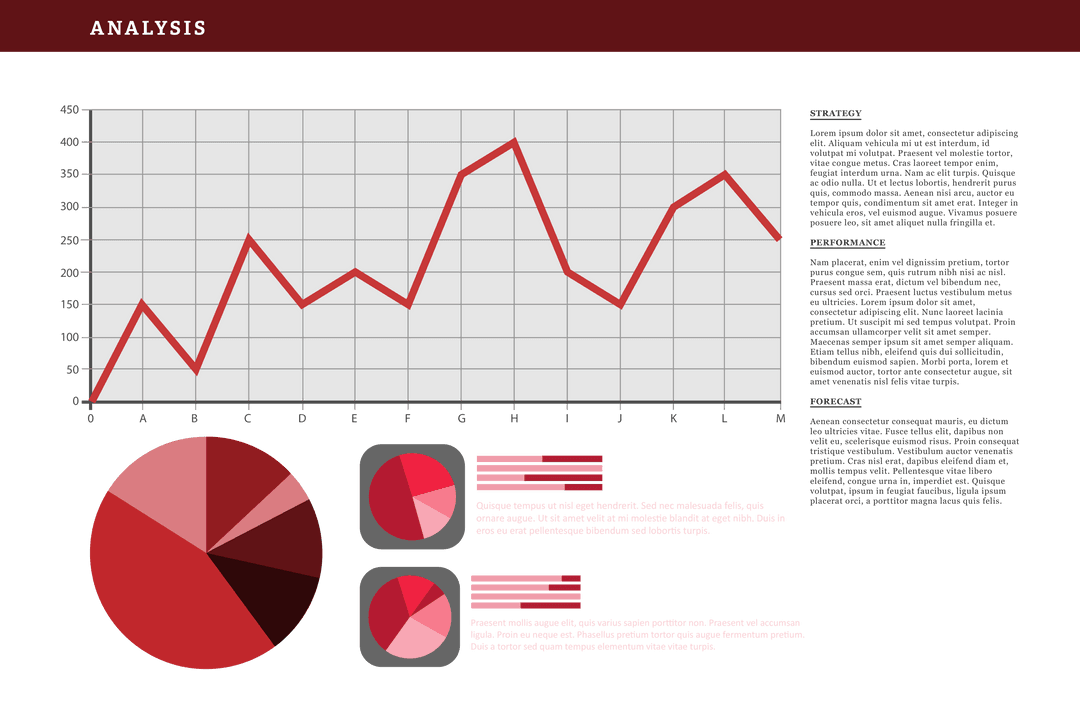
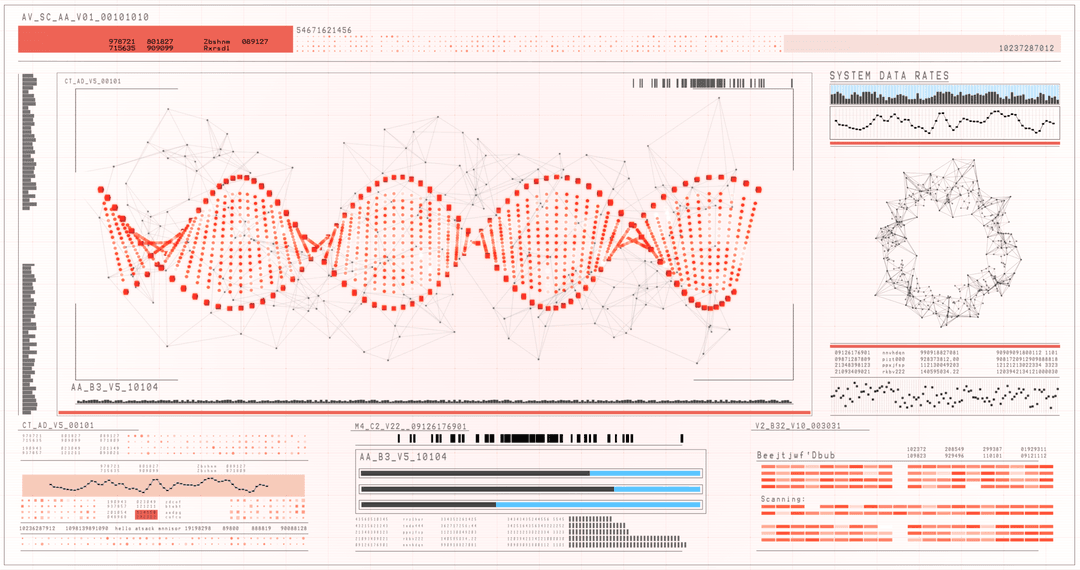
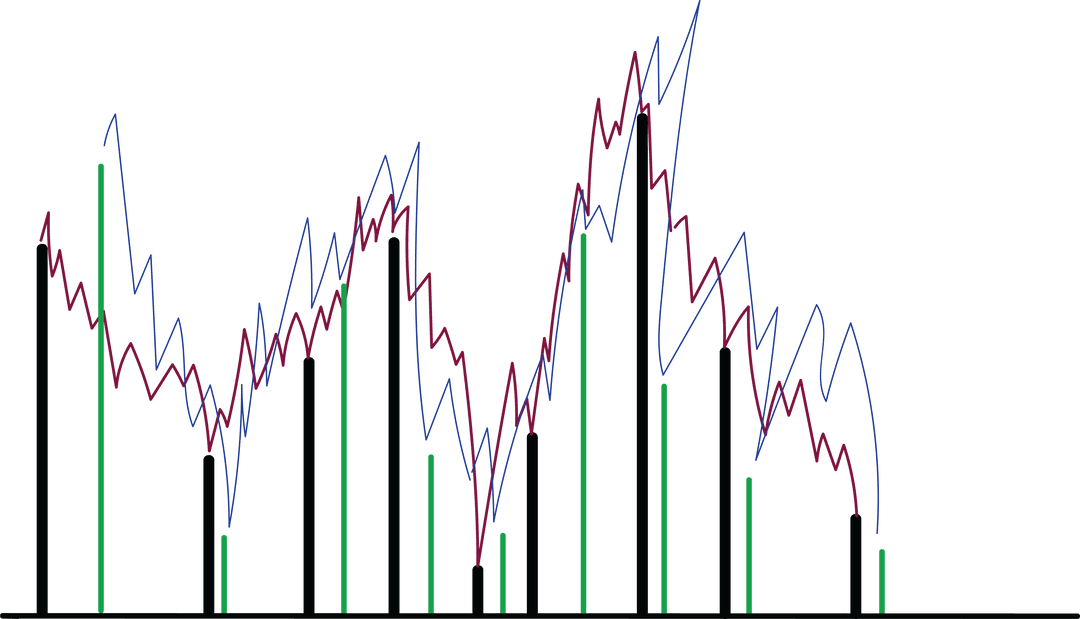
- Transparent Chart Diagram Showing Data Trends and Medical Analysis
Transparent Chart Diagram Showing Data Trends and Medical Analysis PNG
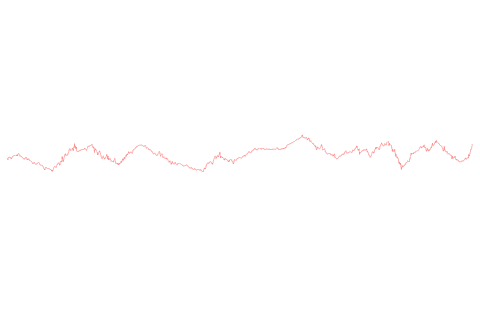
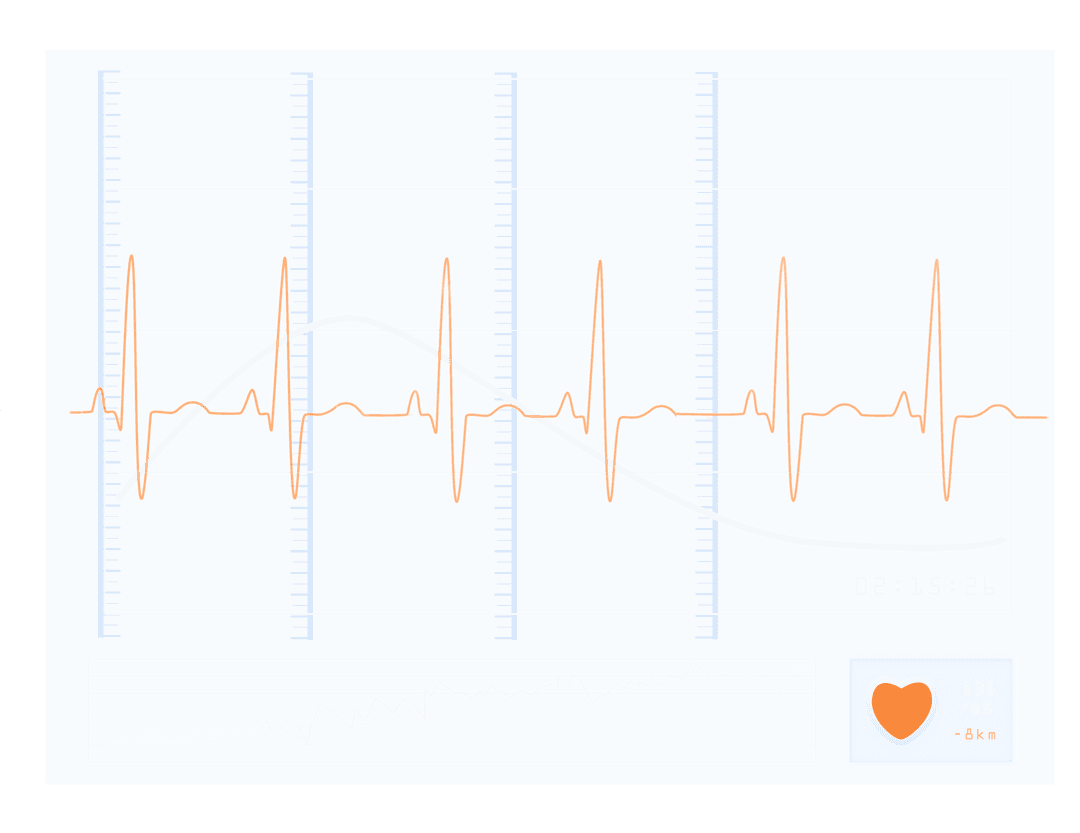
The image presents a red fluctuating line resembling data trends or wave pattern on a clear background, ideal for illustrating data analysis, scientific research, and health-related topics. It can be used in presentations, reports, and articles focusing on data interpretation and medical graphs.
Powered by  - Get 15% off with code: PIKWIZARD15


Credit Photo
If you would like to credit the Photo, here are some ways you can do so
Text Link
png Link
<span class="text-link">
<span>
<a target="_blank" href=https://pikwizard.com/png/transparent-chart-diagram-showing-data-trends-and-medical-analysis/51ca00525ec72ebea97a1be04ca1081d/>PikWizard</a>
</span>
</span>
<span class="image-link">
<span
style="margin: 0 0 20px 0; display: inline-block; vertical-align: middle; width: 100%;"
>
<a
target="_blank"
href="https://pikwizard.com/png/transparent-chart-diagram-showing-data-trends-and-medical-analysis/51ca00525ec72ebea97a1be04ca1081d/"
style="text-decoration: none; font-size: 10px; margin: 0;"
>
<img src="https://pikwizard.com/pw/medium/51ca00525ec72ebea97a1be04ca1081d.png" style="margin: 0; width: 100%;" alt="" />
<p style="font-size: 12px; margin: 0;">PikWizard</p>
</a>
</span>
</span>
Free (free of charge)
Free for personal and commercial use.
Author: Creative Art
Similar Free PNG Images With Transparent Background
Premium


Premium


Premium


Premium


Premium

Premium


Premium


Premium


Premium


Premium


Premium


Premium


Premium


Premium


Premium


Premium


Premium


Premium


Premium


Premium


Premium


Premium


Premium


Premium