- Home >
- Stock PNGs >
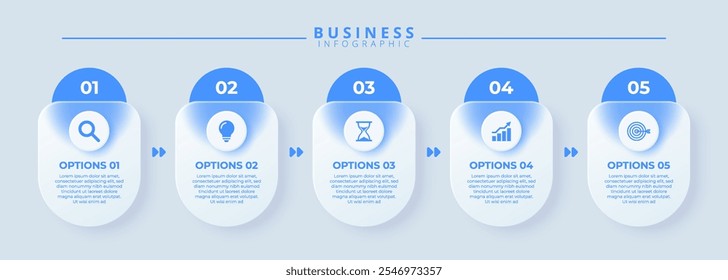
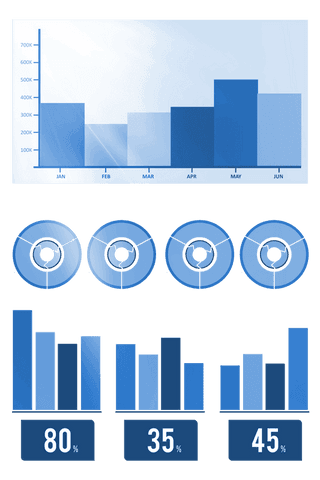
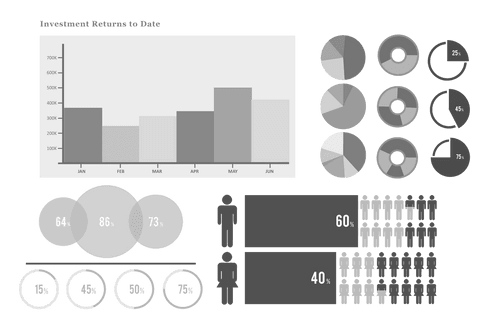
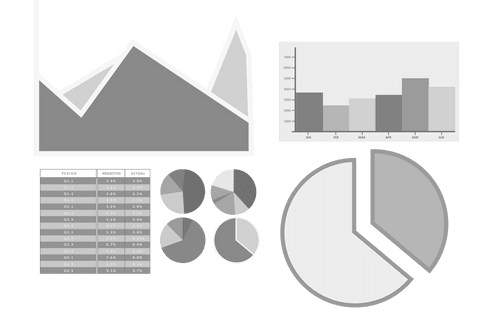
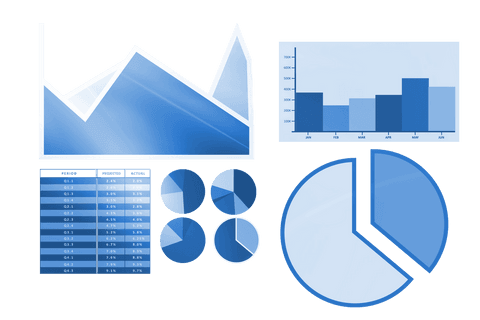
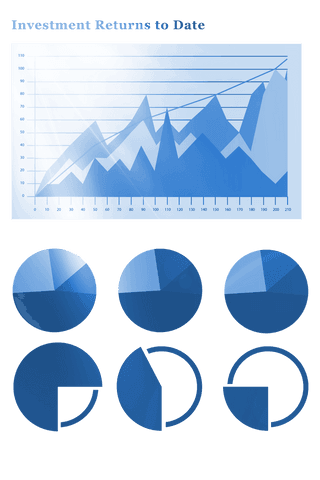
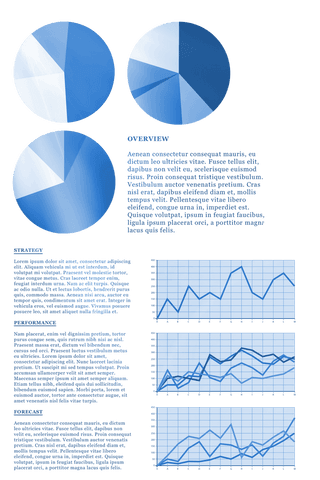
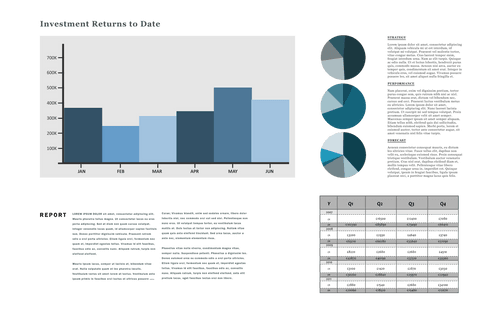
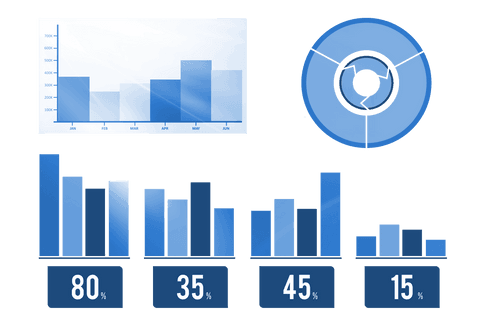
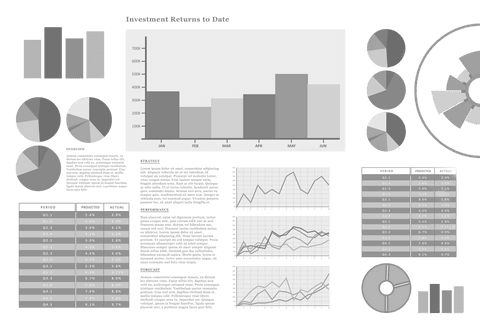
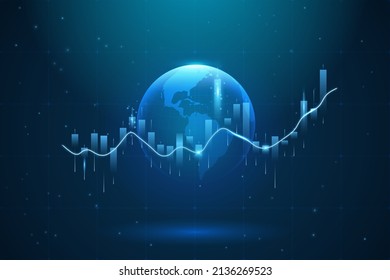
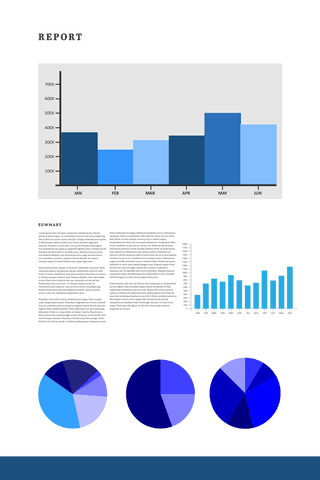
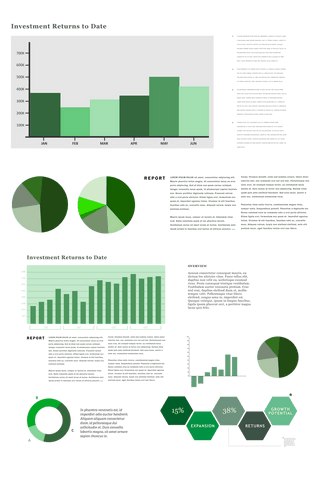
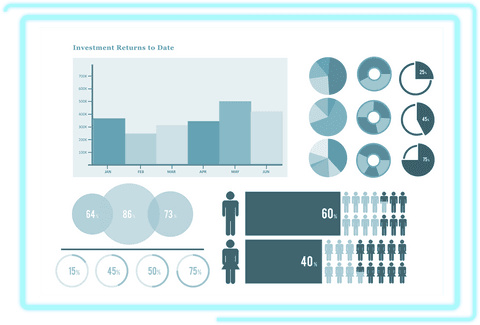
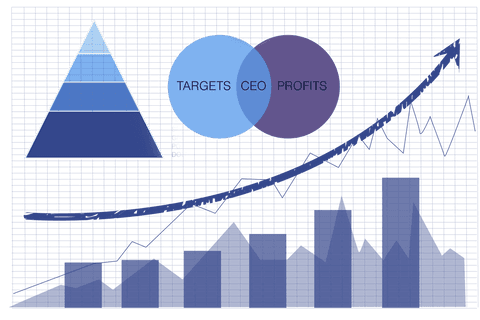
- Transparent Chart Diagrams Illustrating Economic Trends
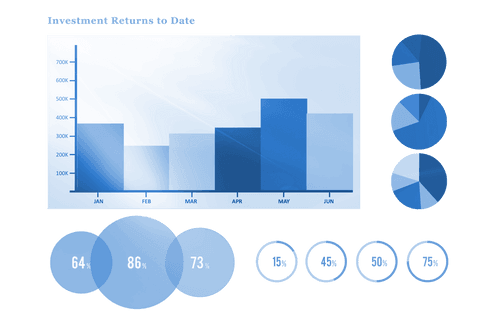
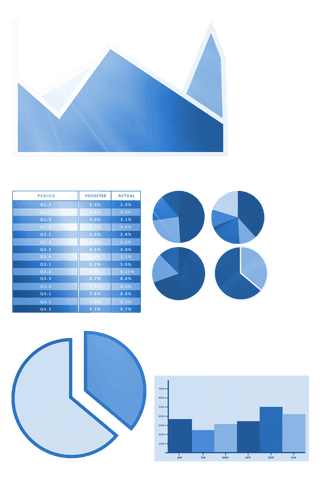
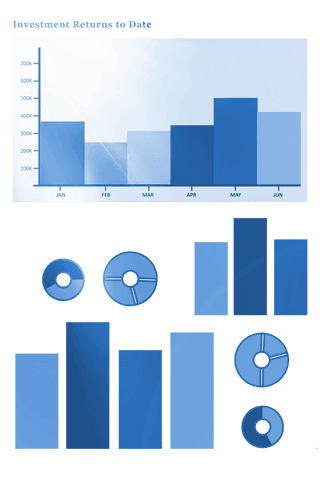
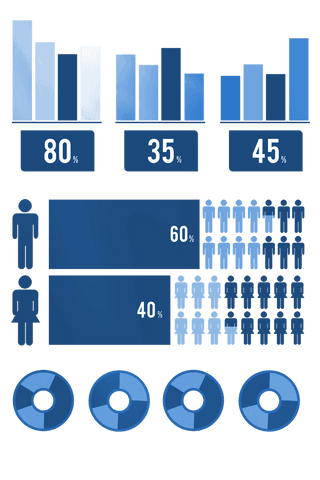
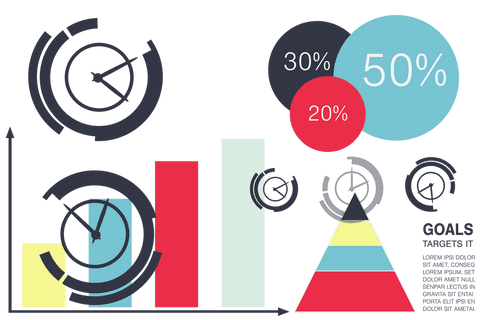
Transparent Chart Diagrams Illustrating Economic Trends PNG
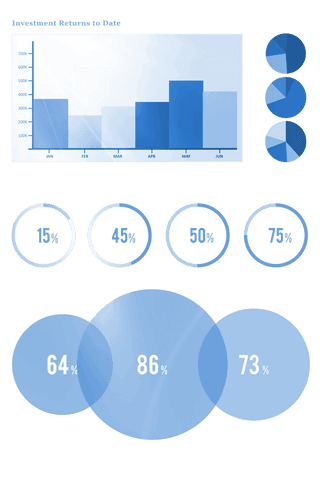
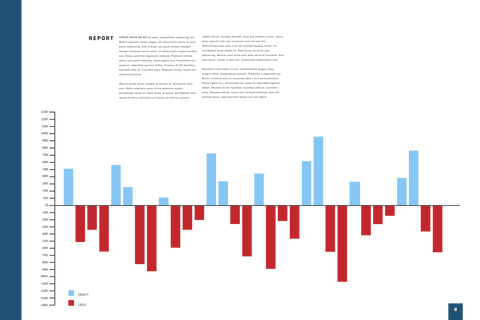
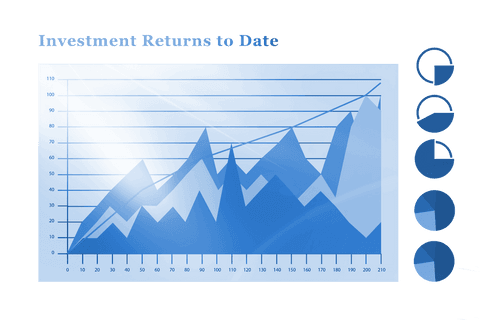
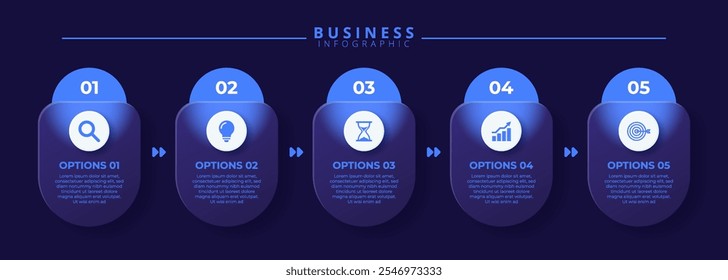
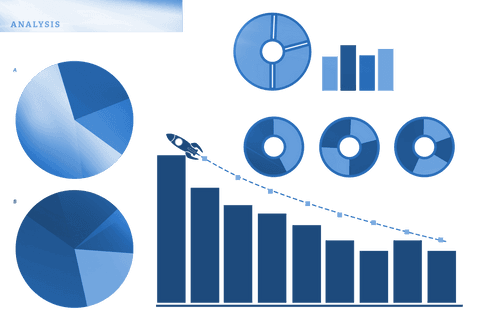
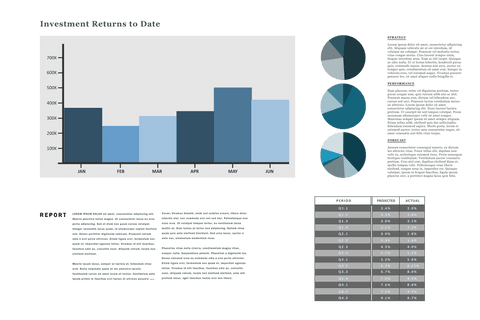
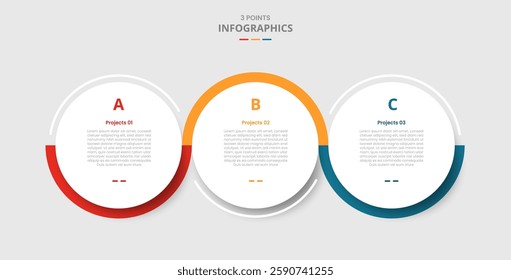
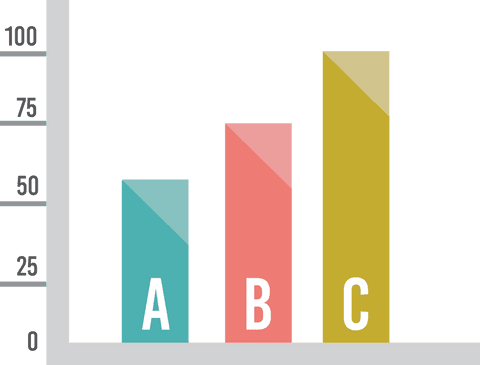
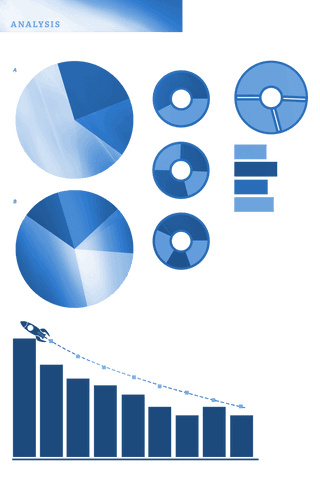
This digitally created illustration on a transparent background presents various chart diagrams for economic and financial analytics. The vector style and clarity make it ideal for enhancing PowerPoint presentations, embedding in business reports, or use on websites to visually convey financial data and statistical trends.
Powered by  - Get 15% off with code: PIKWIZARD15


0
downloads
downloads
Tags:
More
Credit Photo
If you would like to credit the Photo, here are some ways you can do so
Text Link
png Link
<span class="text-link">
<span>
<a target="_blank" href=https://pikwizard.com/png/transparent-chart-diagrams-illustrating-economic-trends/6abcdd8385ab7df76a8146ea6c667060/>PikWizard</a>
</span>
</span>
<span class="image-link">
<span
style="margin: 0 0 20px 0; display: inline-block; vertical-align: middle; width: 100%;"
>
<a
target="_blank"
href="https://pikwizard.com/png/transparent-chart-diagrams-illustrating-economic-trends/6abcdd8385ab7df76a8146ea6c667060/"
style="text-decoration: none; font-size: 10px; margin: 0;"
>
<img src="https://pikwizard.com/pw/medium/6abcdd8385ab7df76a8146ea6c667060.png" style="margin: 0; width: 100%;" alt="" />
<p style="font-size: 12px; margin: 0;">PikWizard</p>
</a>
</span>
</span>
Free (free of charge)
Free for personal and commercial use.
Author: Authentic Images
Similar Free PNG Images With Transparent Background
Loading...


Premium
Premium

Premium


Premium
Premium


Premium


Premium


Premium


Premium


Premium

Premium


Premium


Premium


Premium
Premium


Premium

Premium

Premium


Premium


Premium

Premium

Premium


Premium

Premium


Premium