
- Home >
- Stock PNGs >
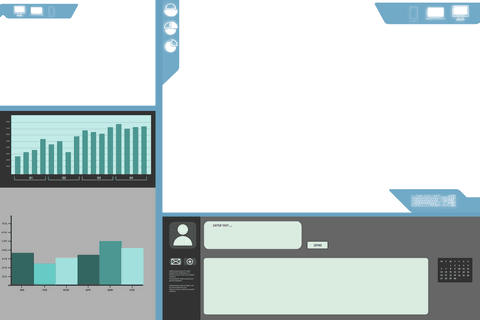
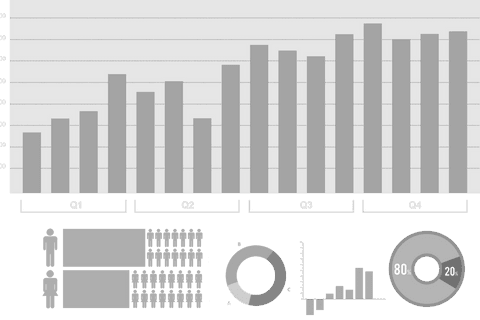
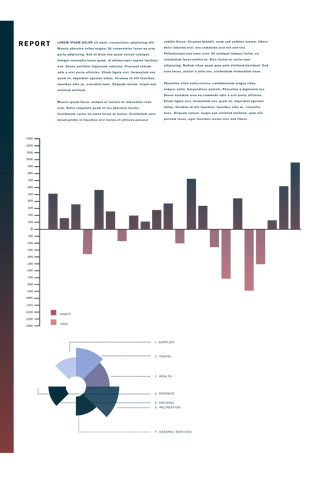
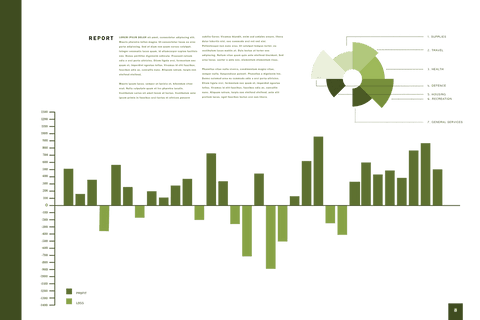
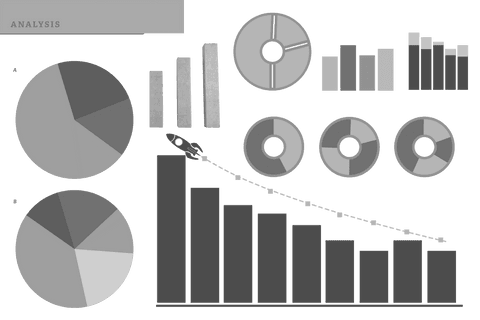
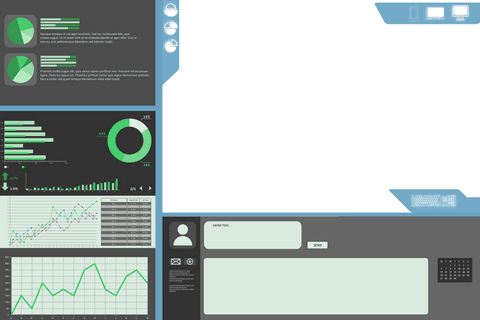
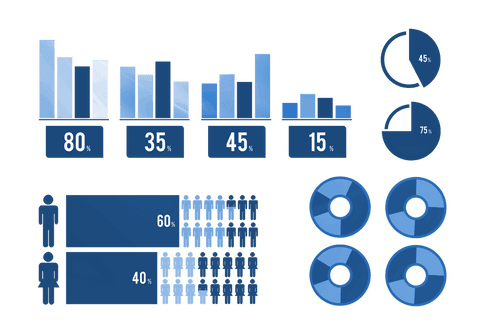
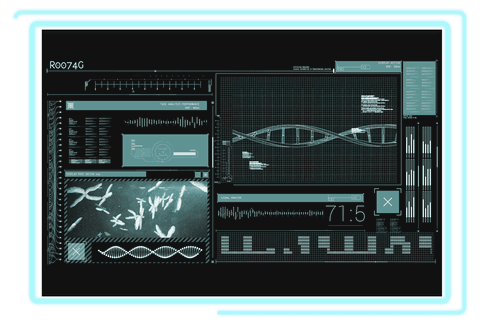
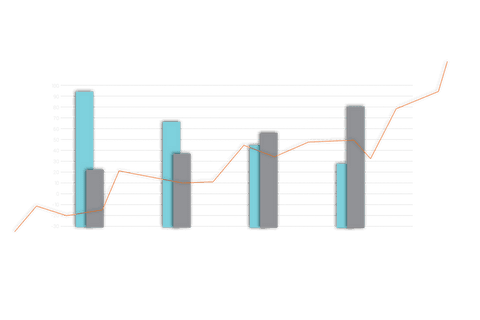
- Transparent Data Processing Diagram with Bar Charts
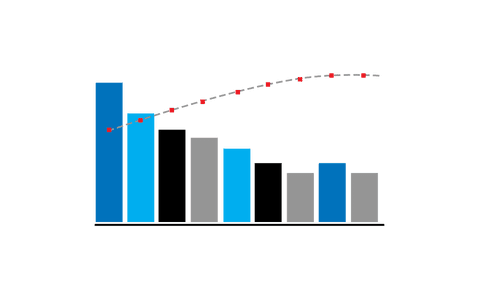
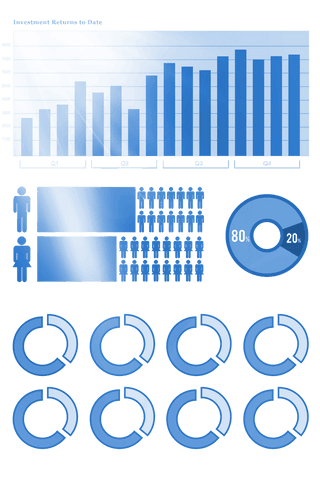
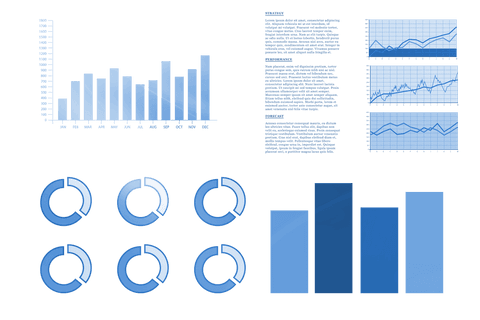
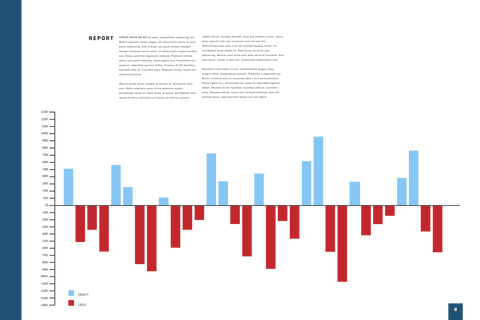
Transparent Data Processing Diagram with Bar Charts PNG
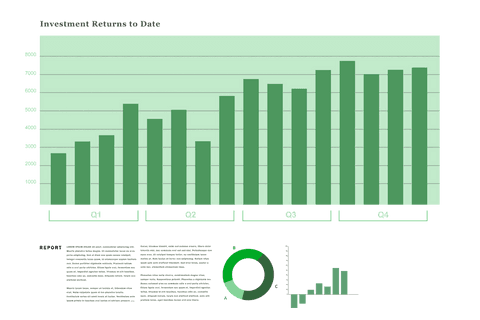
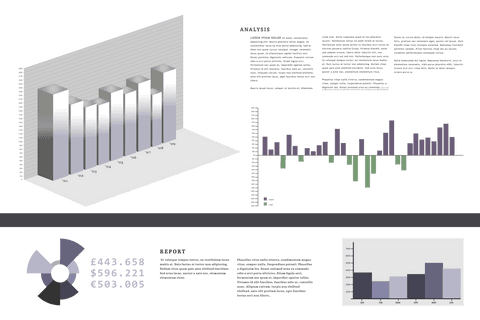
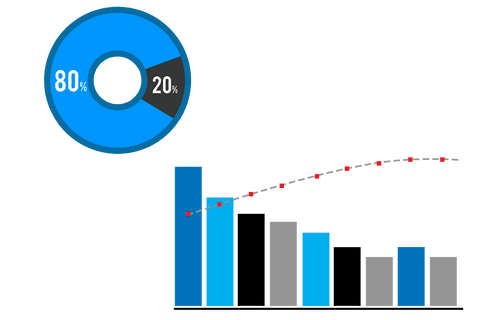
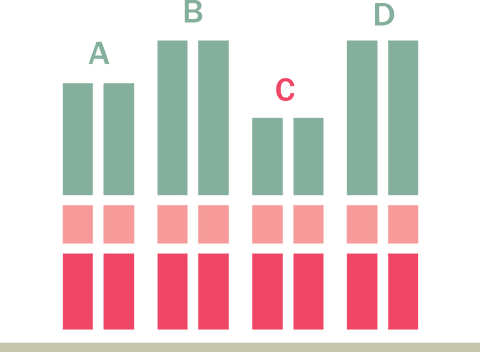
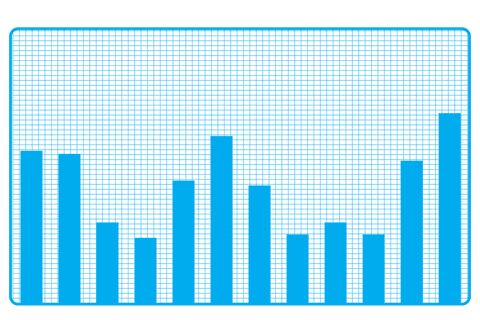
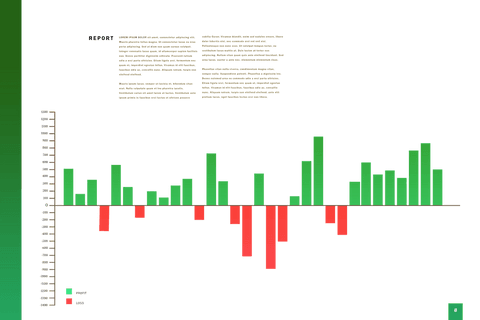
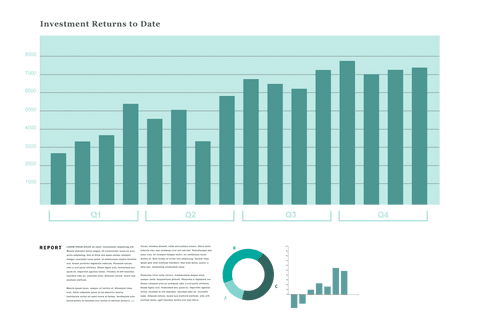
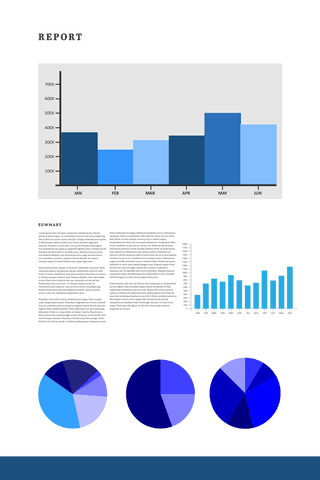
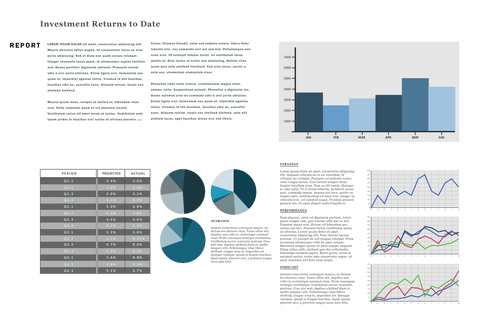
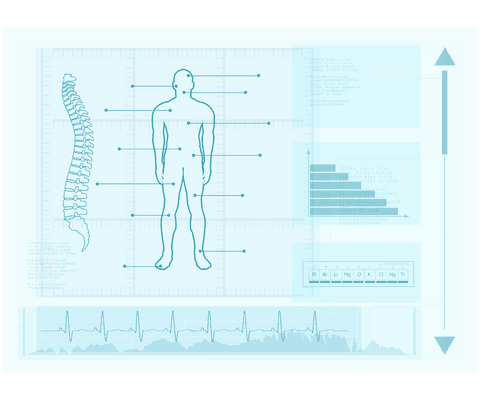
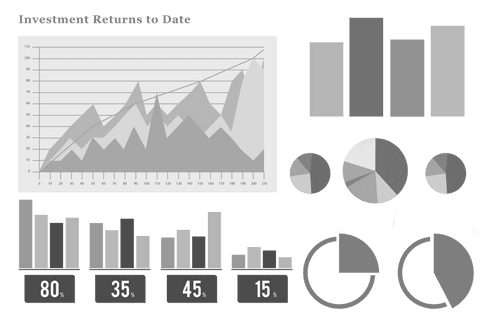
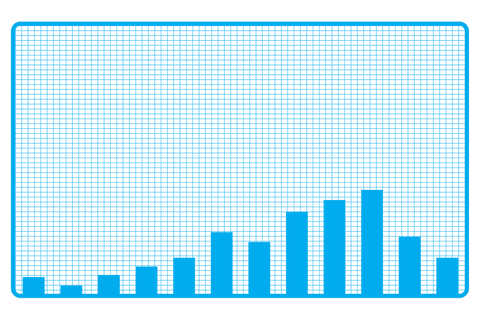
Illustration showcasing data processing with bar charts on transparent background. Ideal for presentations, reports, and educational materials focusing on finance and statistical analysis.
Powered by 


downloads
Tags:
More
Credit Photo
If you would like to credit the Photo, here are some ways you can do so
Text Link
png Link
<span class="text-link">
<span>
<a target="_blank" href=https://pikwizard.com/png/transparent-data-processing-diagram-with-bar-charts/69cadffdf11d4c057e405ce1a4a3e498/>PikWizard</a>
</span>
</span>
<span class="image-link">
<span
style="margin: 0 0 20px 0; display: inline-block; vertical-align: middle; width: 100%;"
>
<a
target="_blank"
href="https://pikwizard.com/png/transparent-data-processing-diagram-with-bar-charts/69cadffdf11d4c057e405ce1a4a3e498/"
style="text-decoration: none; font-size: 10px; margin: 0;"
>
<img src="https://pikwizard.com/pw/medium/69cadffdf11d4c057e405ce1a4a3e498.png" style="margin: 0; width: 100%;" alt="" />
<p style="font-size: 12px; margin: 0;">PikWizard</p>
</a>
</span>
</span>
Free (free of charge)
Free for personal and commercial use.
Author: Creative Art
Similar Free PNG Images With Transparent Background


Premium


Premium


Premium


Premium

Premium

Premium


Premium

Premium

Premium
Premium


Explore More Free PNGs