- Home >
- Stock PNGs >
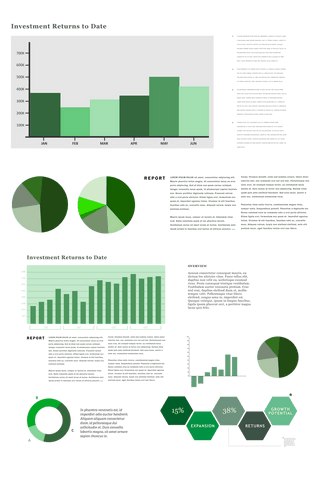
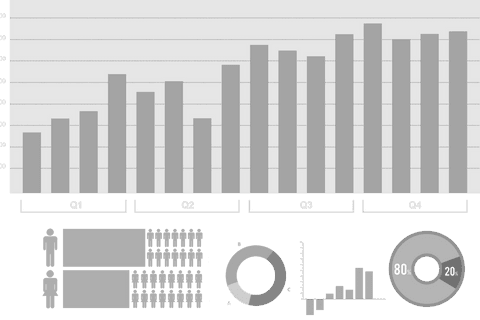
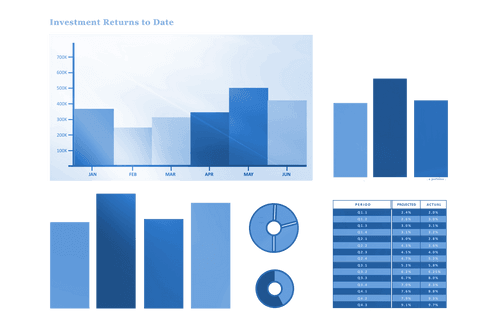
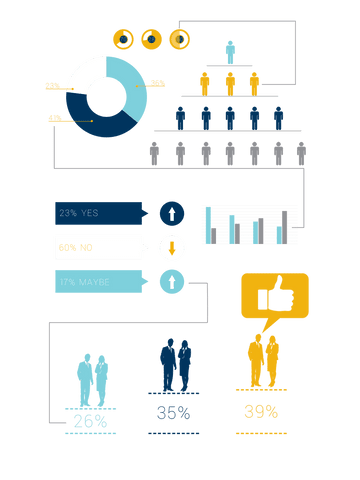
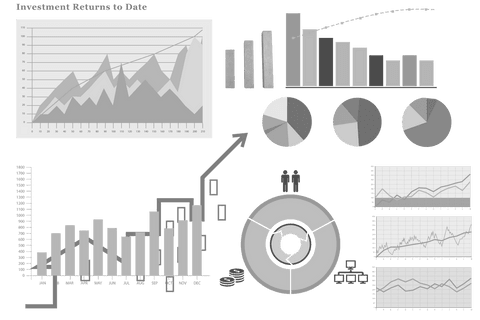
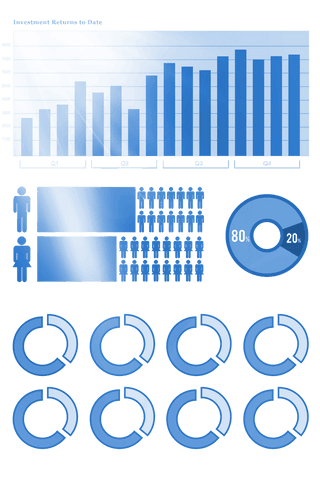
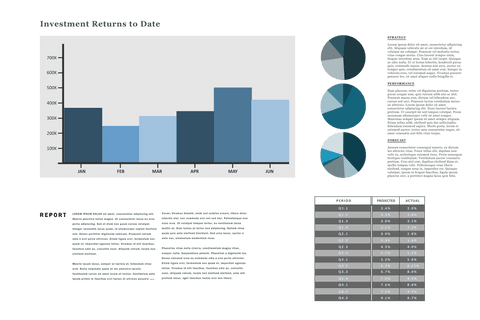
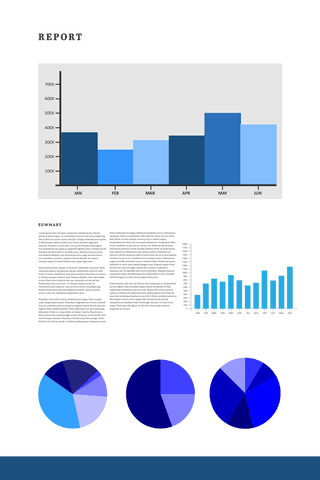
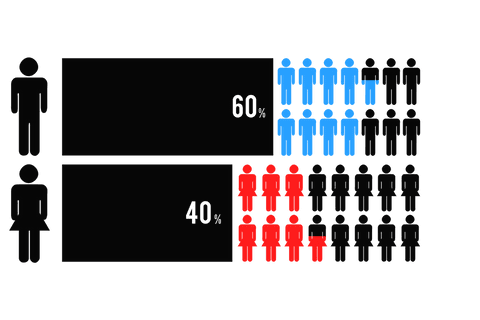
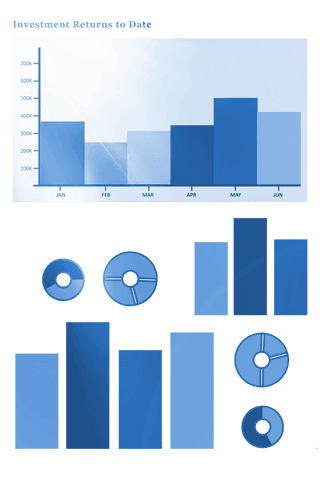
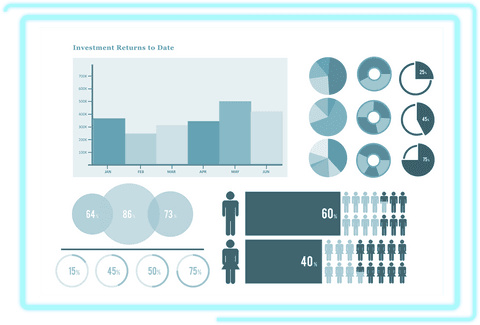
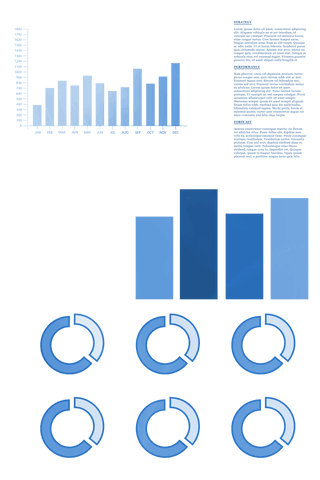
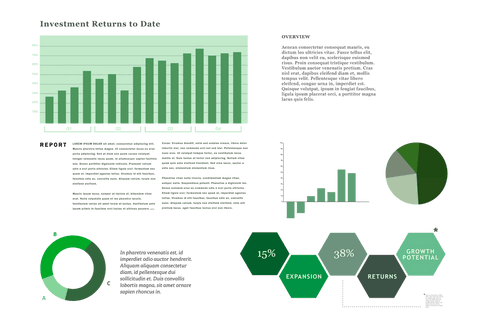
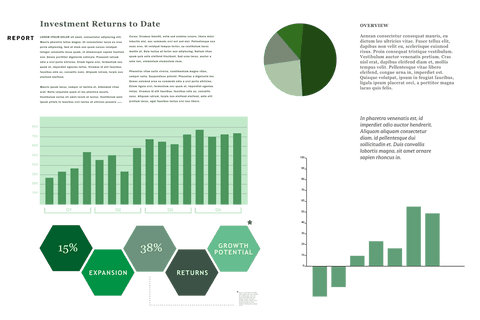
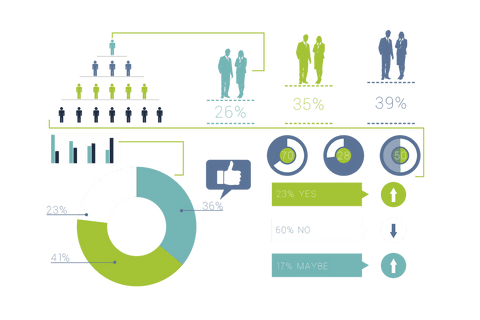
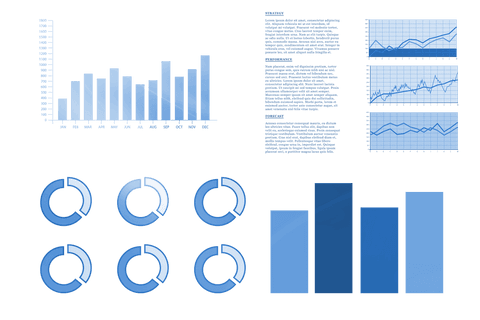
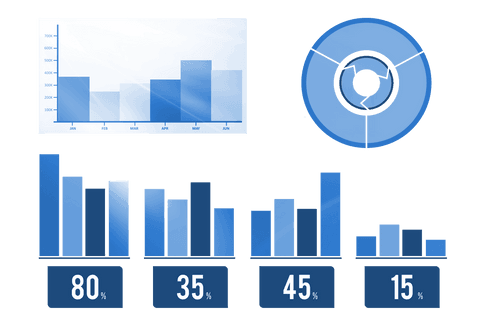
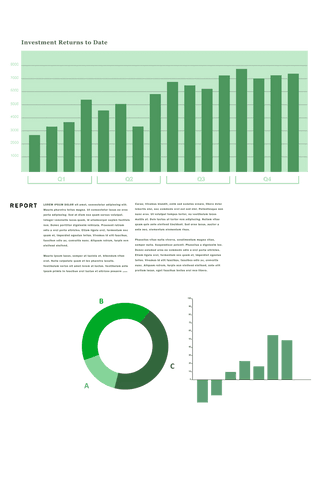
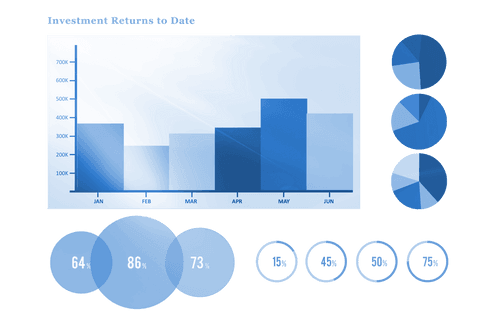
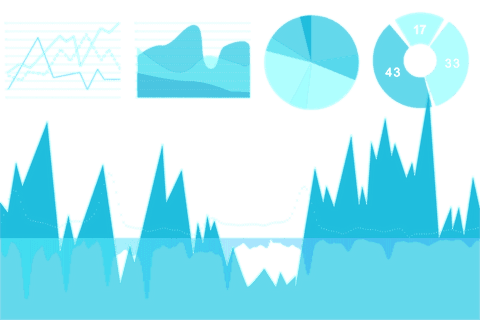
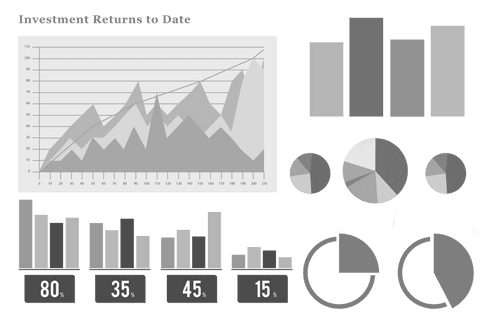
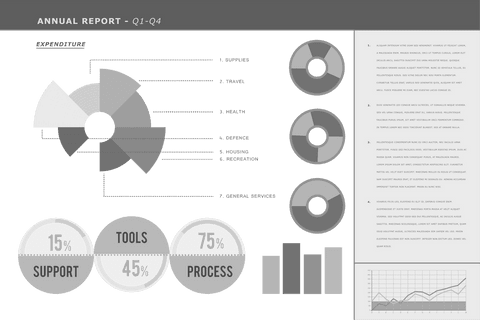
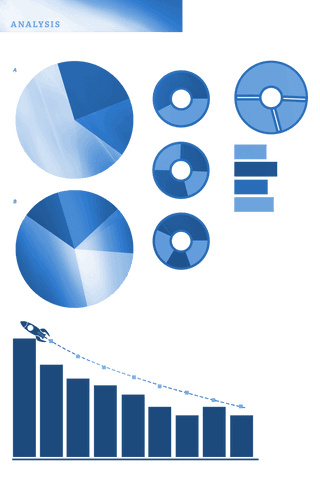
- Transparent Data Visualization with Graphs and Human Icons
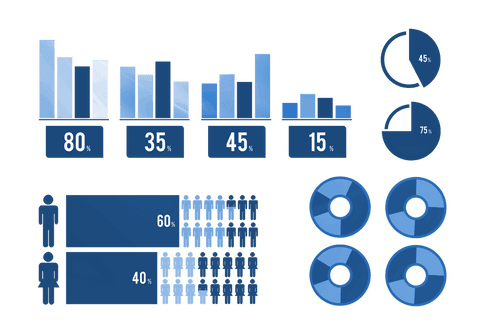
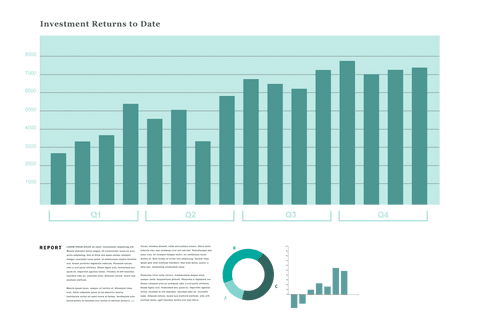
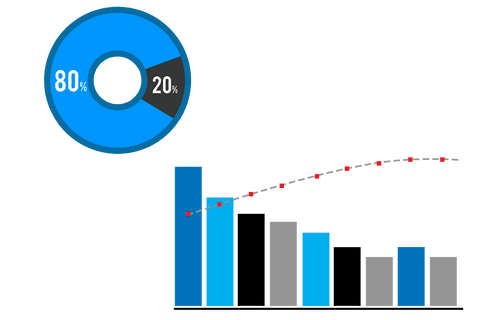
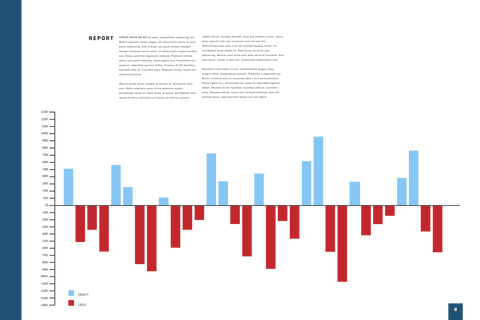
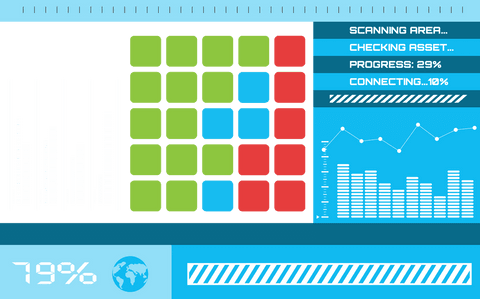
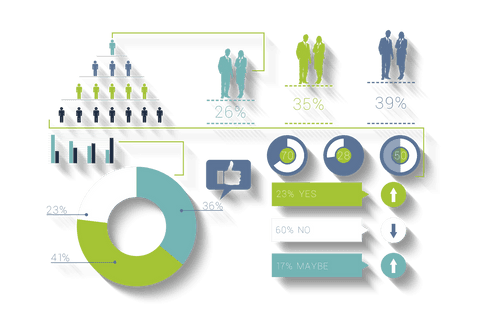
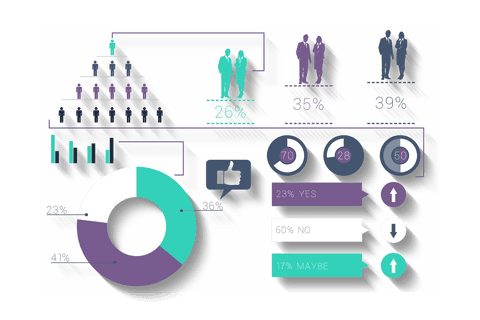
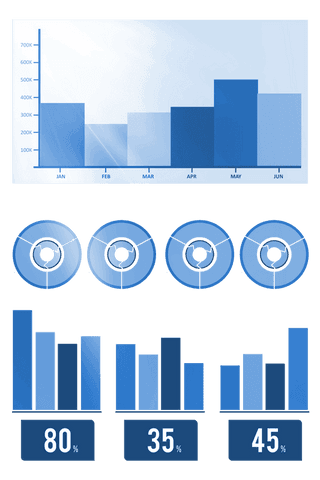
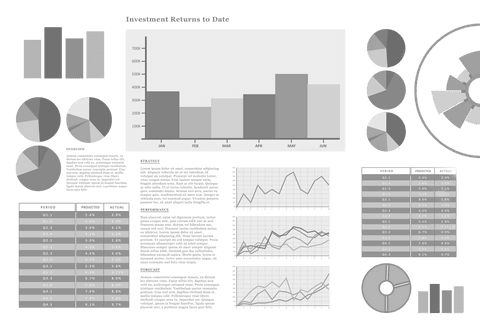
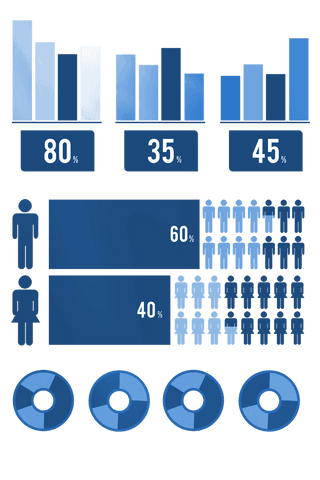
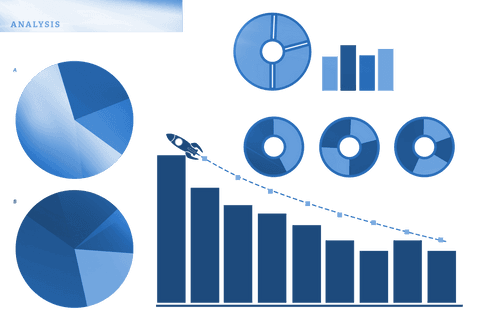
Transparent Data Visualization with Graphs and Human Icons PNG
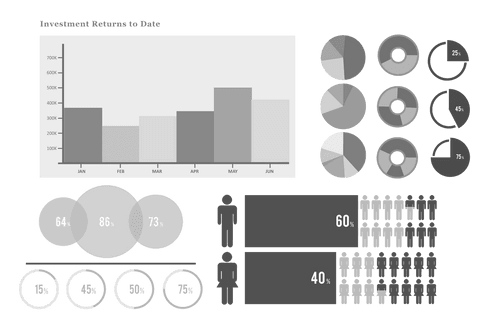
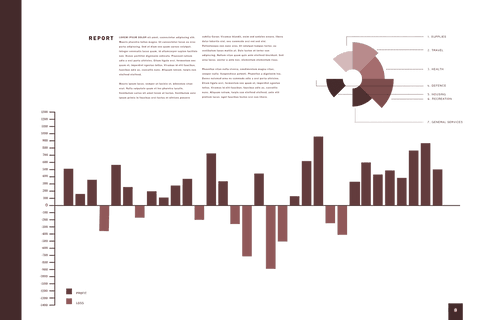
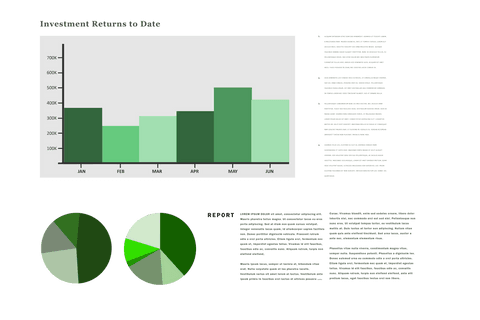
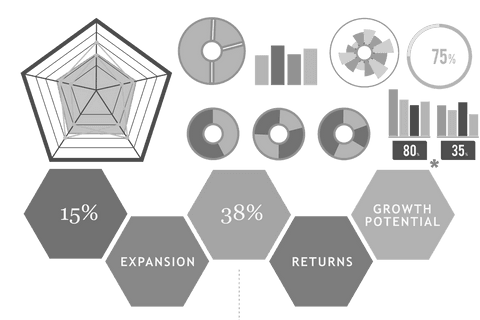
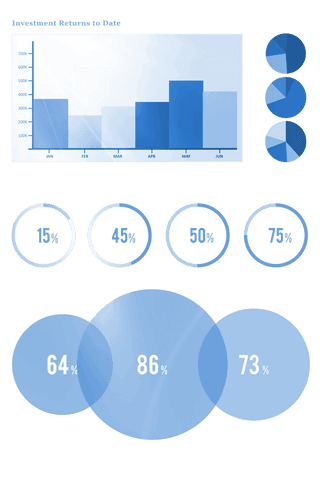
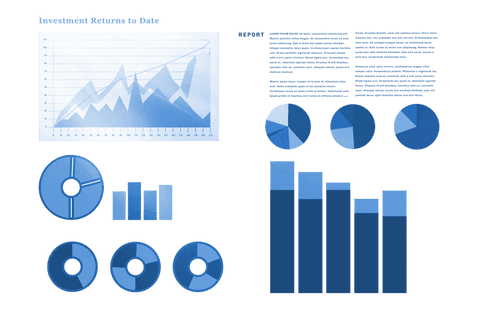
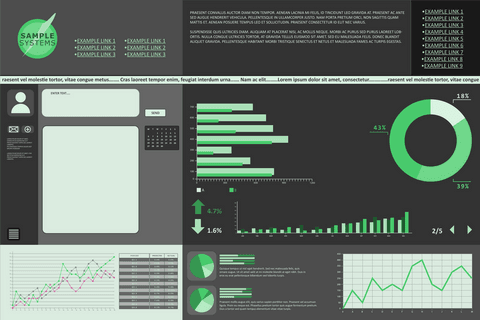
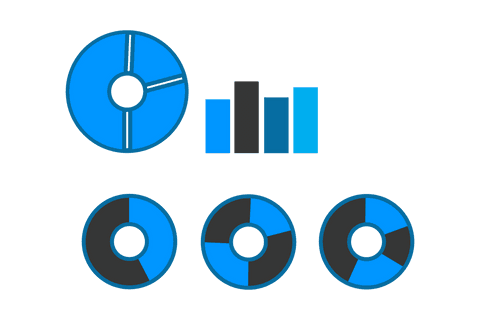
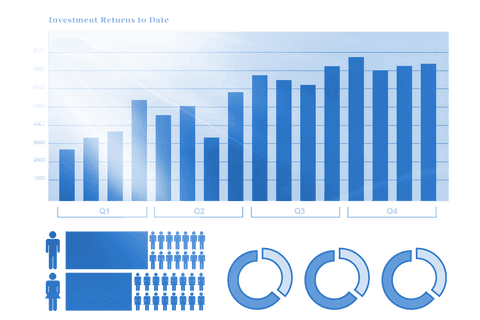
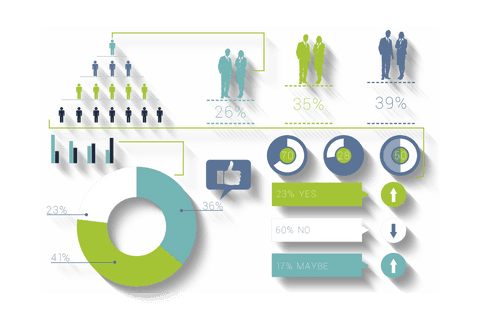
This transparent-themed data visualization features various chart types, such as bar charts and pie charts, along with human icons representing statistical data. Useful for business presentations, educational materials, or analytical reports, this visualization aids in interpreting complex data with clarity.

downloads
Tags:
More
Credit Photo
If you would like to credit the Photo, here are some ways you can do so
Text Link
png Link
<span class="text-link">
<span>
<a target="_blank" href=https://pikwizard.com/png/transparent-data-visualization-with-graphs-and-human-icons/90d1d588e9327a3ee794e75080d82c9b/>PikWizard</a>
</span>
</span>
<span class="image-link">
<span
style="margin: 0 0 20px 0; display: inline-block; vertical-align: middle; width: 100%;"
>
<a
target="_blank"
href="https://pikwizard.com/png/transparent-data-visualization-with-graphs-and-human-icons/90d1d588e9327a3ee794e75080d82c9b/"
style="text-decoration: none; font-size: 10px; margin: 0;"
>
<img src="https://pikwizard.com/pw/medium/90d1d588e9327a3ee794e75080d82c9b.png" style="margin: 0; width: 100%;" alt="" />
<p style="font-size: 12px; margin: 0;">PikWizard</p>
</a>
</span>
</span>
Free (free of charge)
Free for personal and commercial use.
Author: Authentic Images