
- Home >
- Stock PNGs >
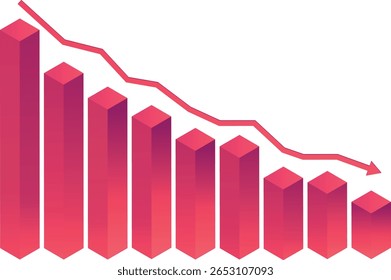
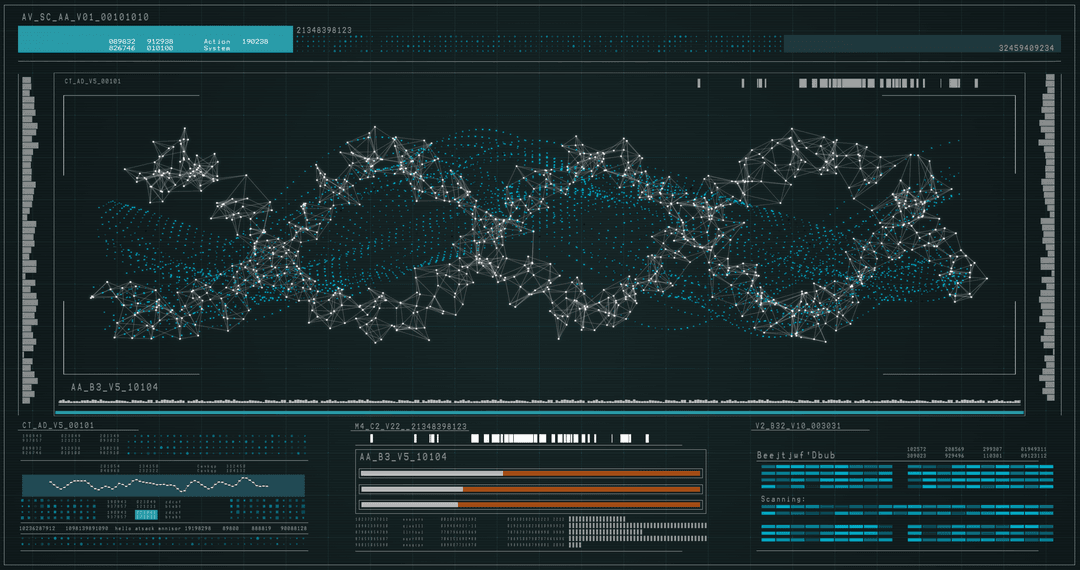
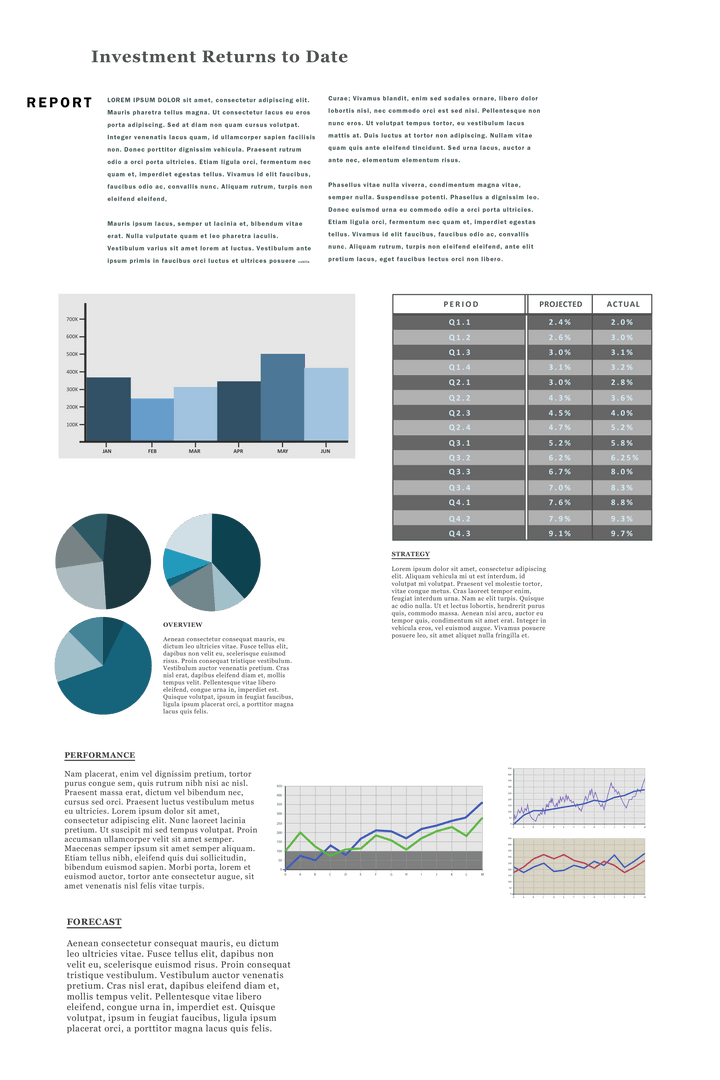
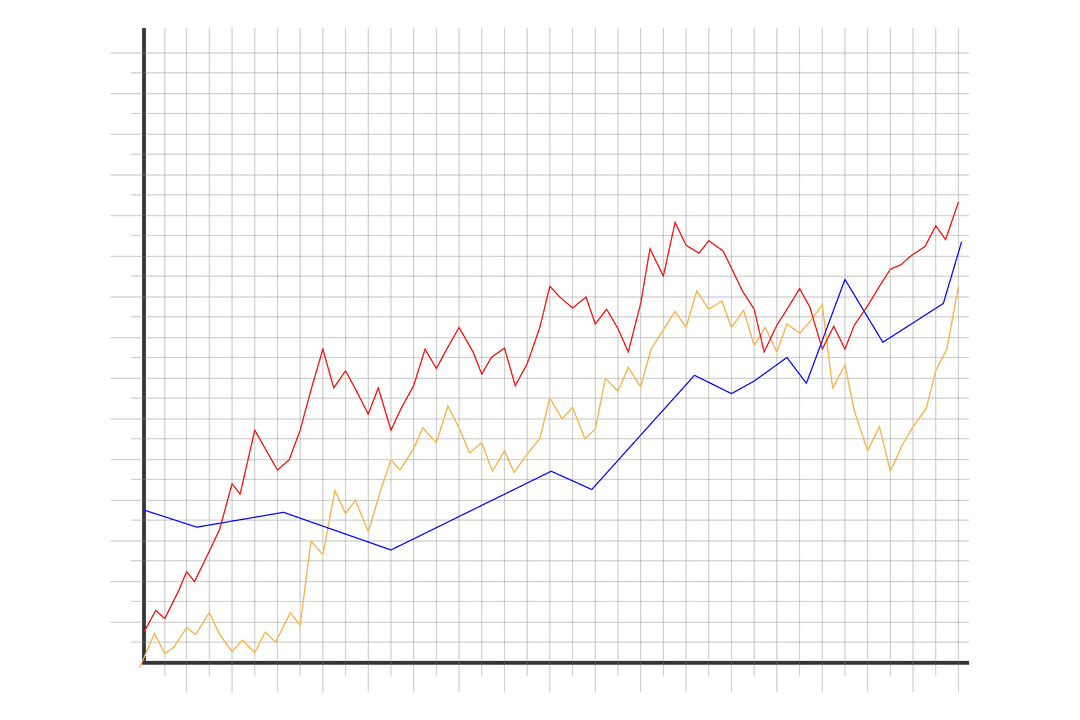
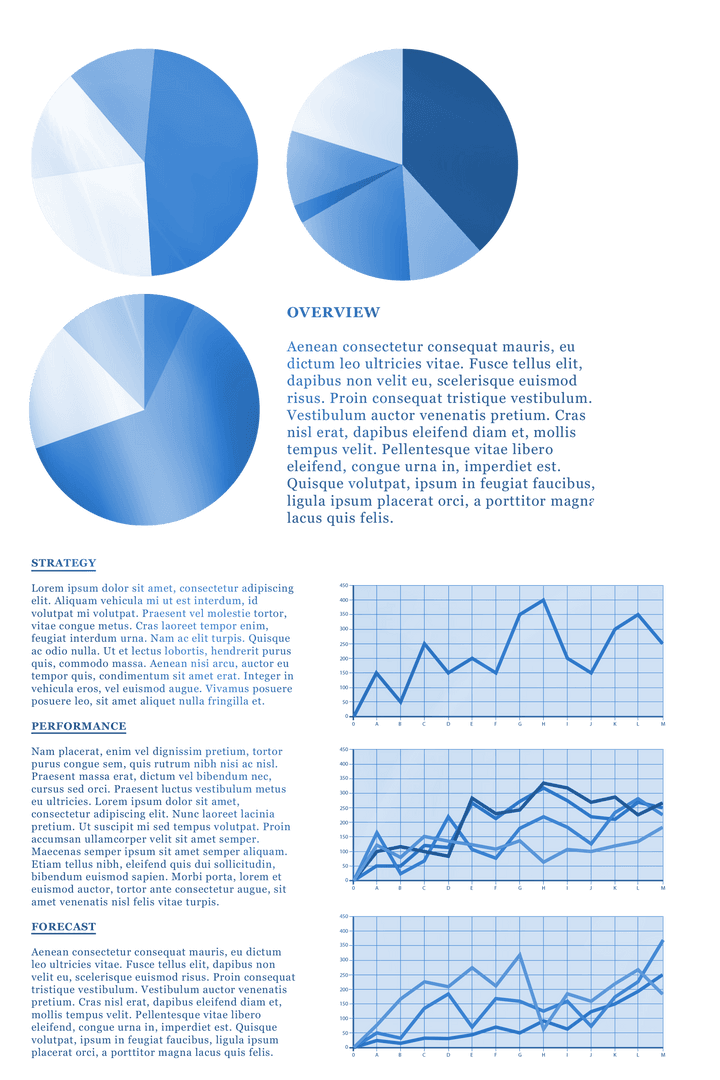
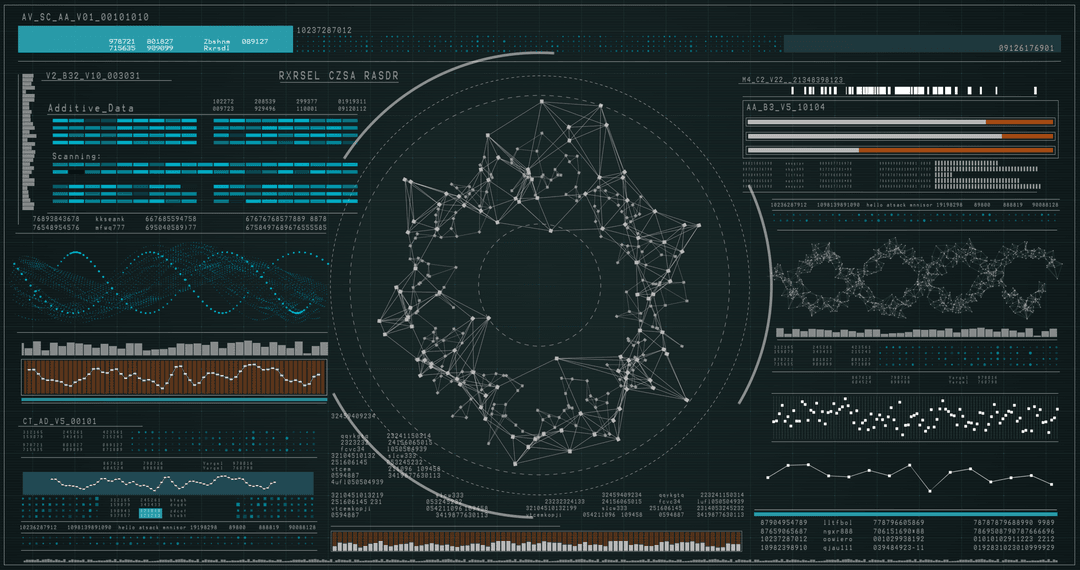
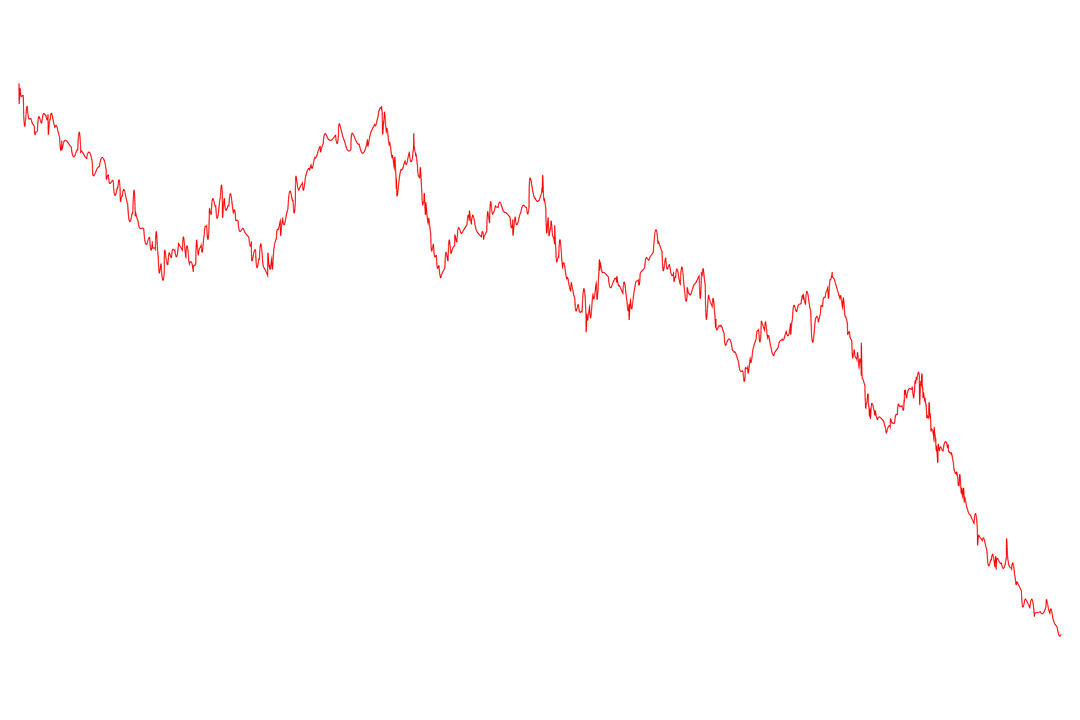
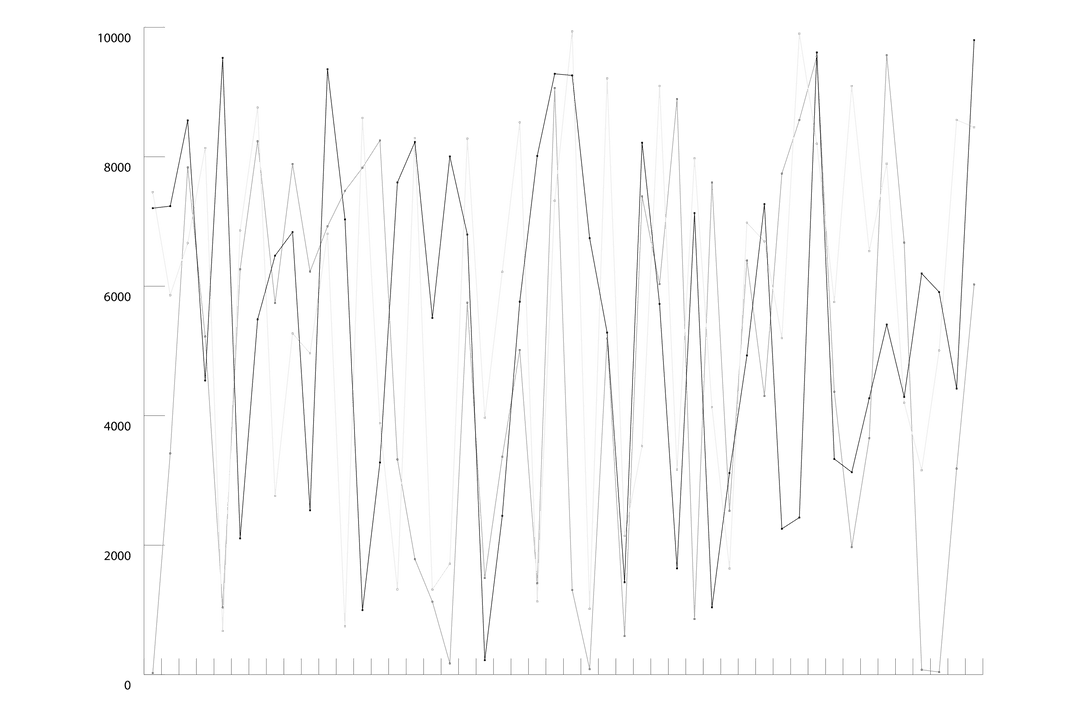
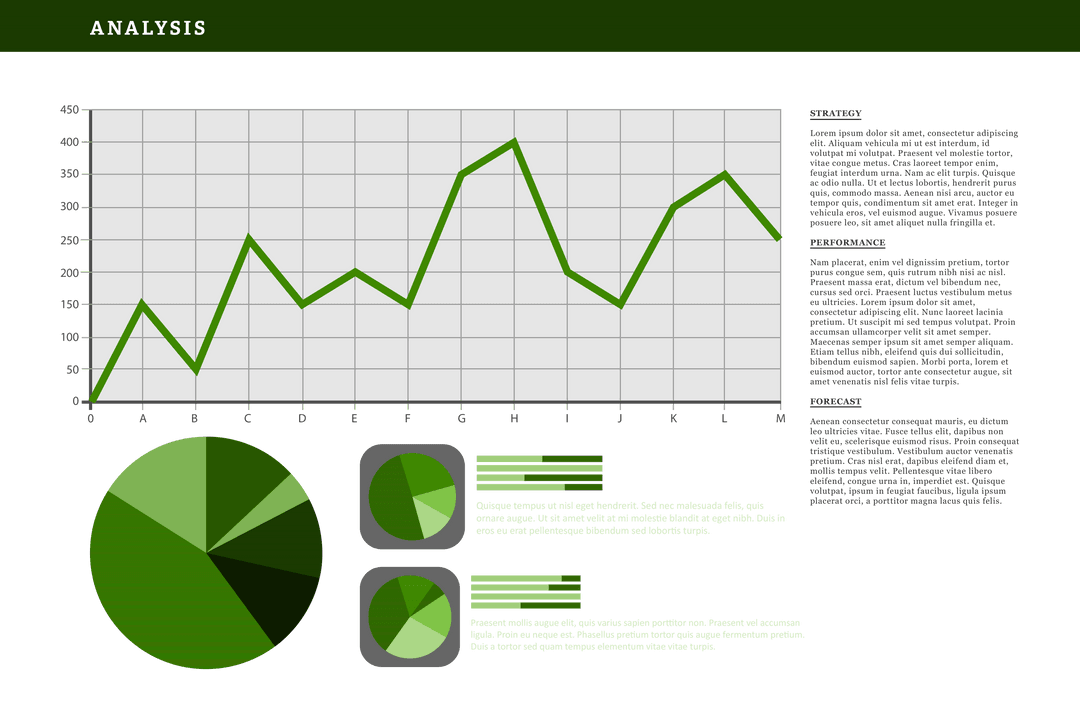
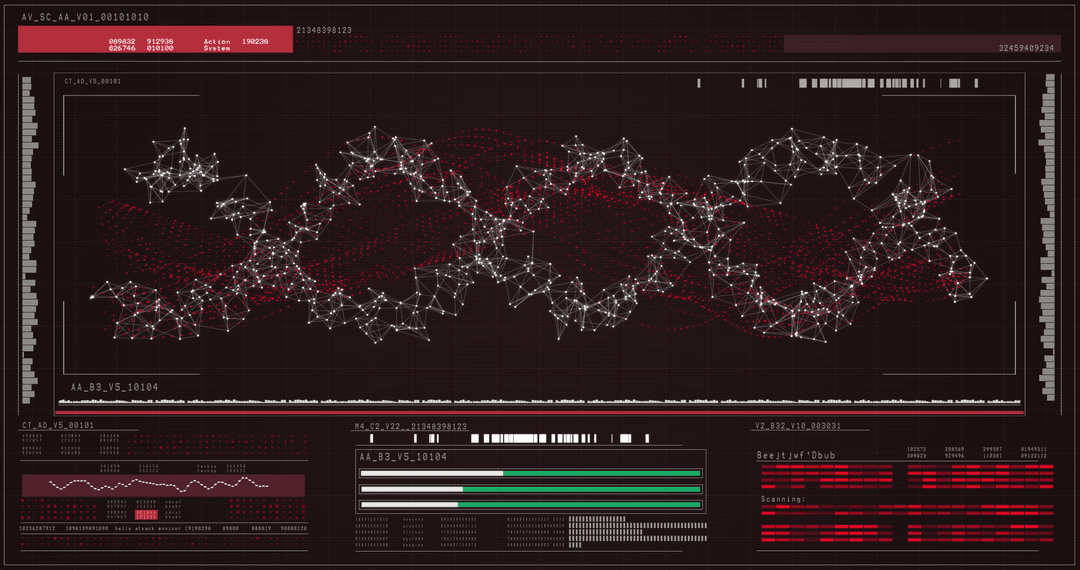
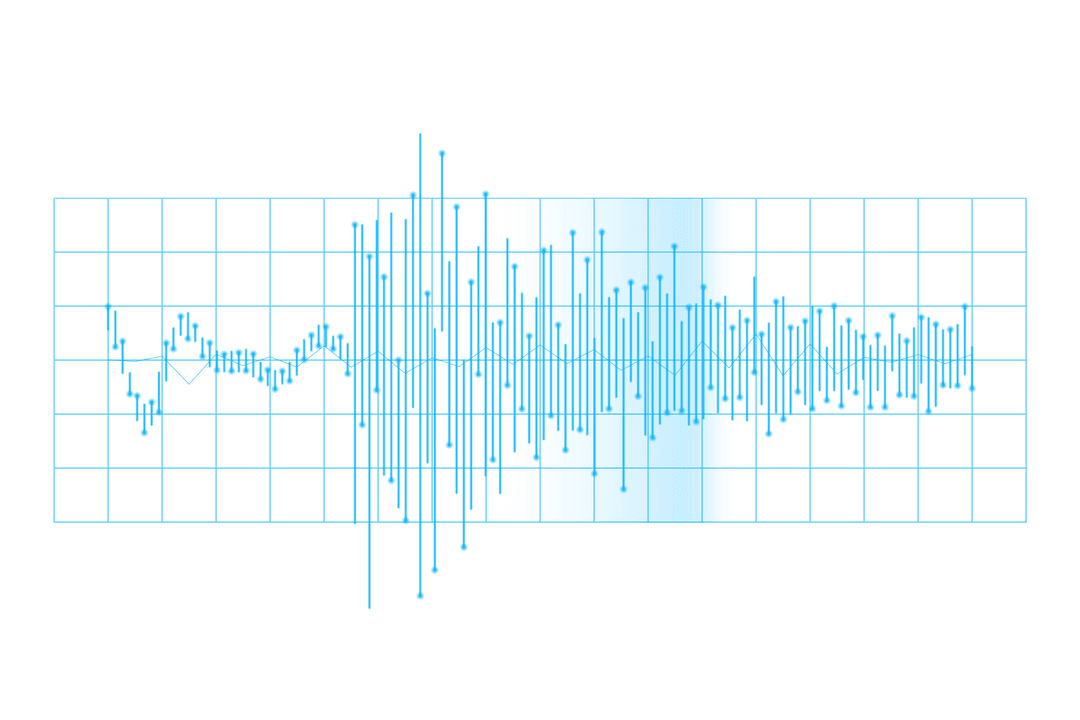
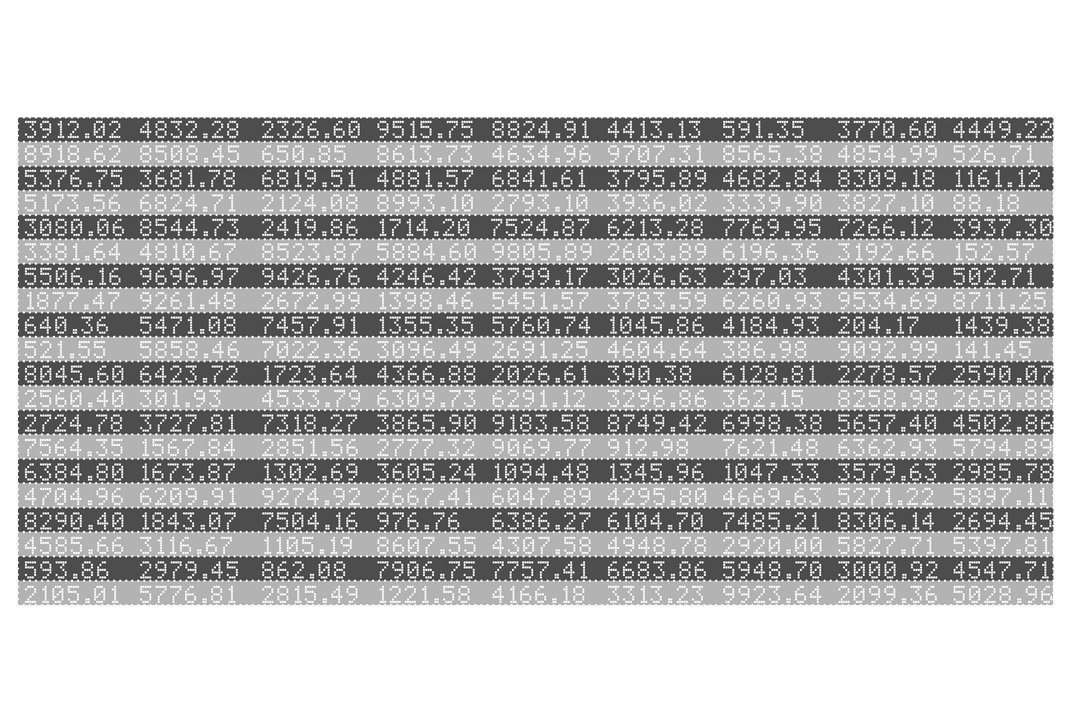
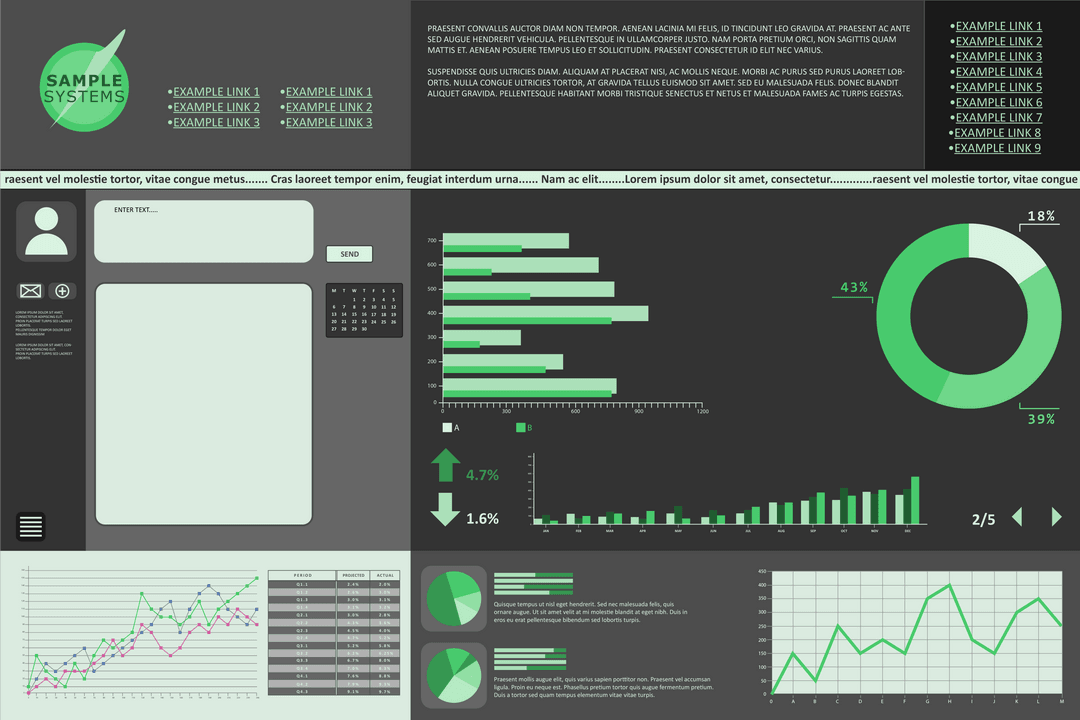
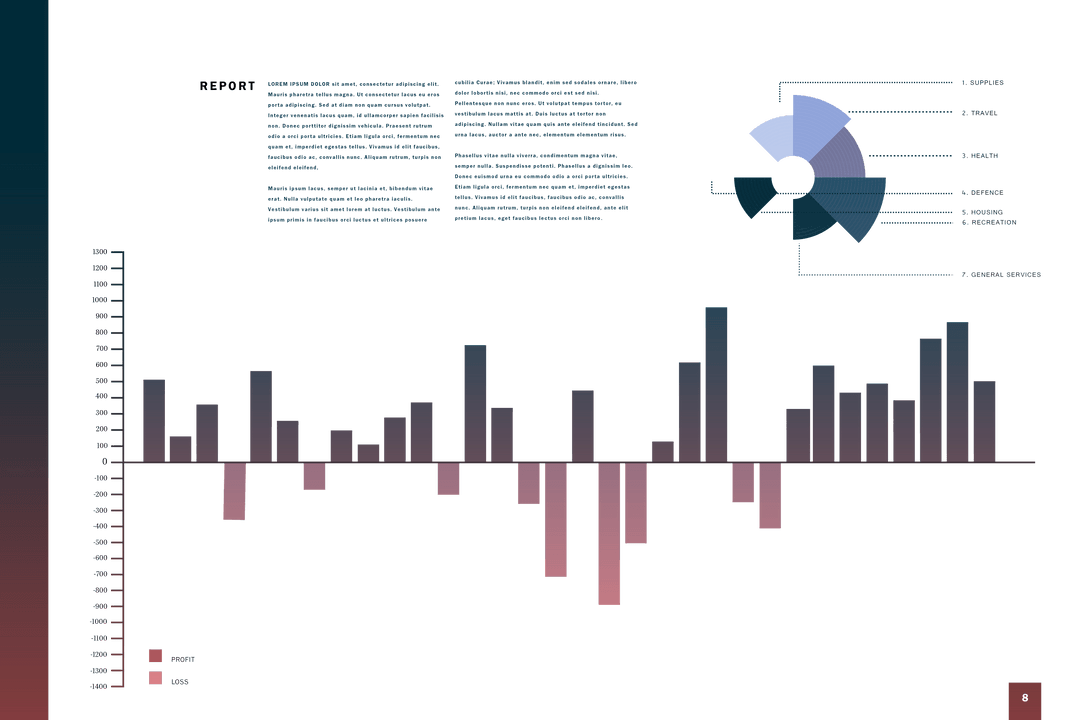
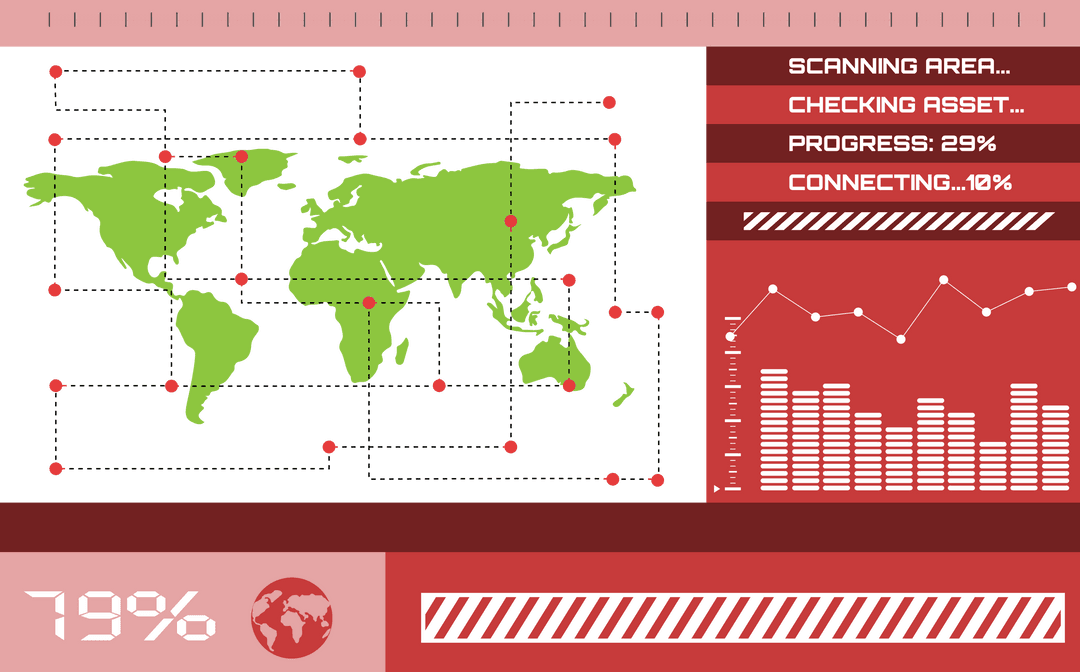
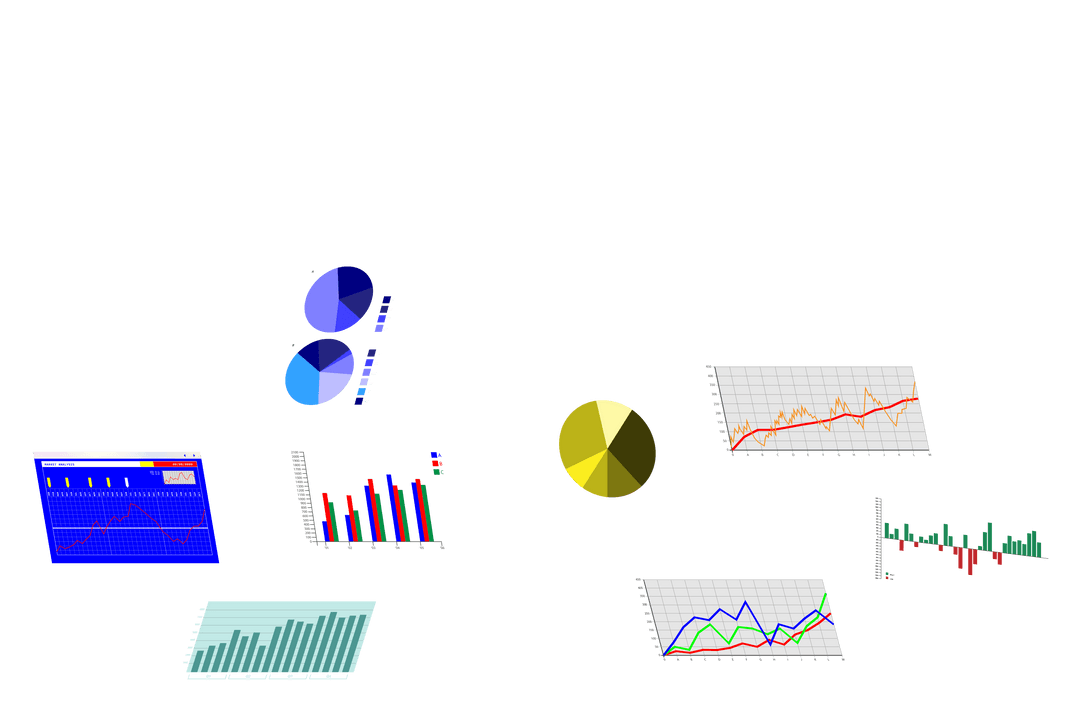
- Transparent Digital Stock Market Diagrams and Data Visualization
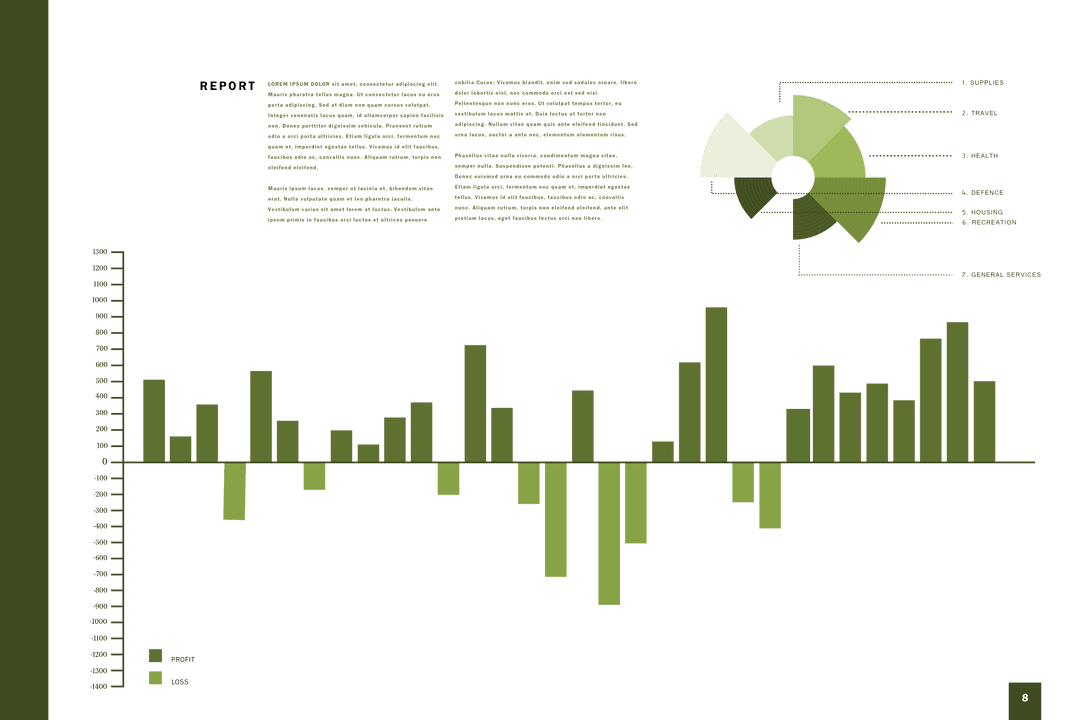
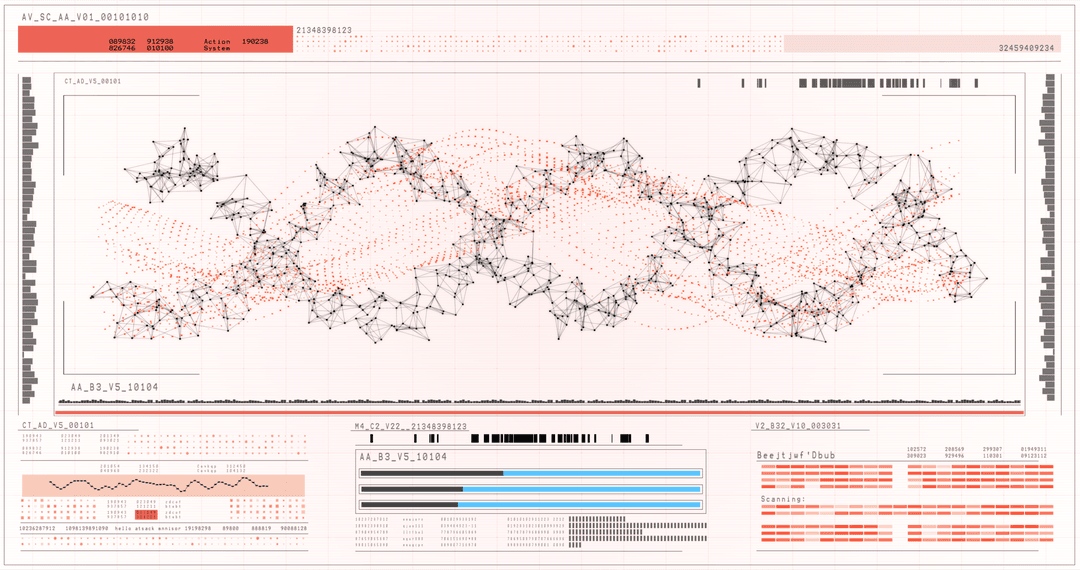
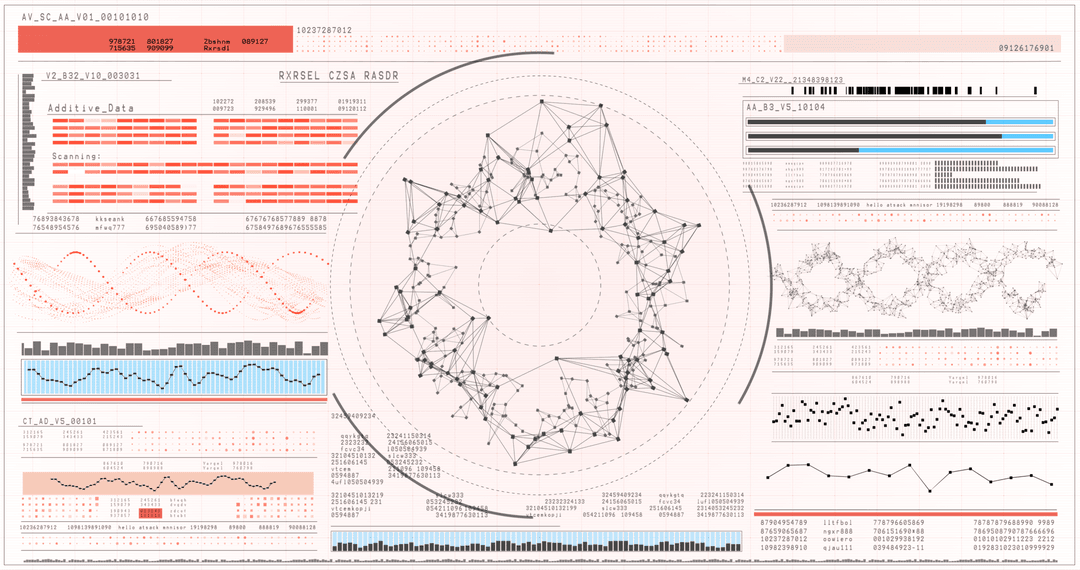
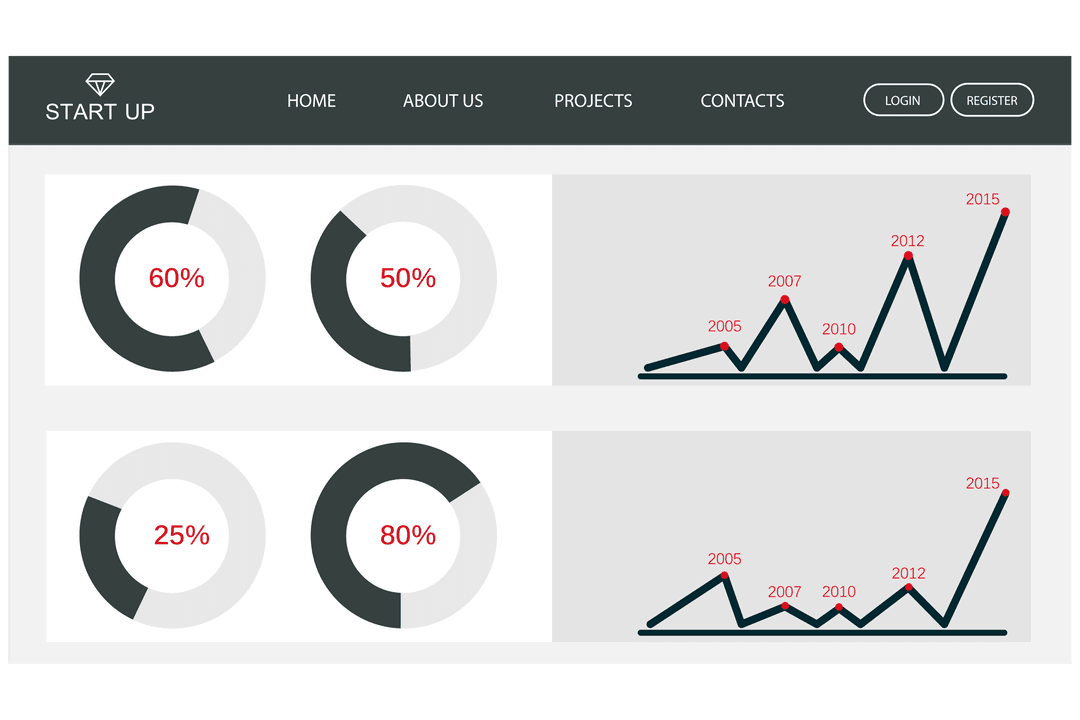
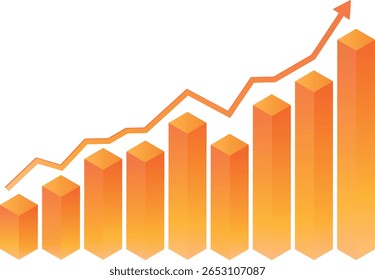
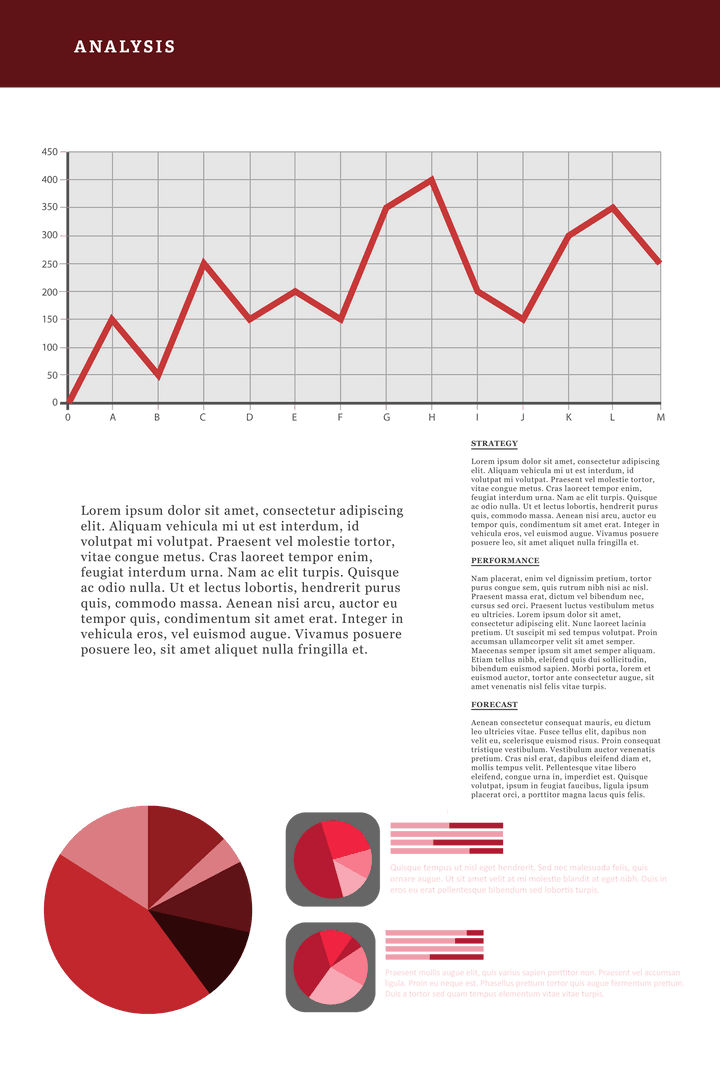
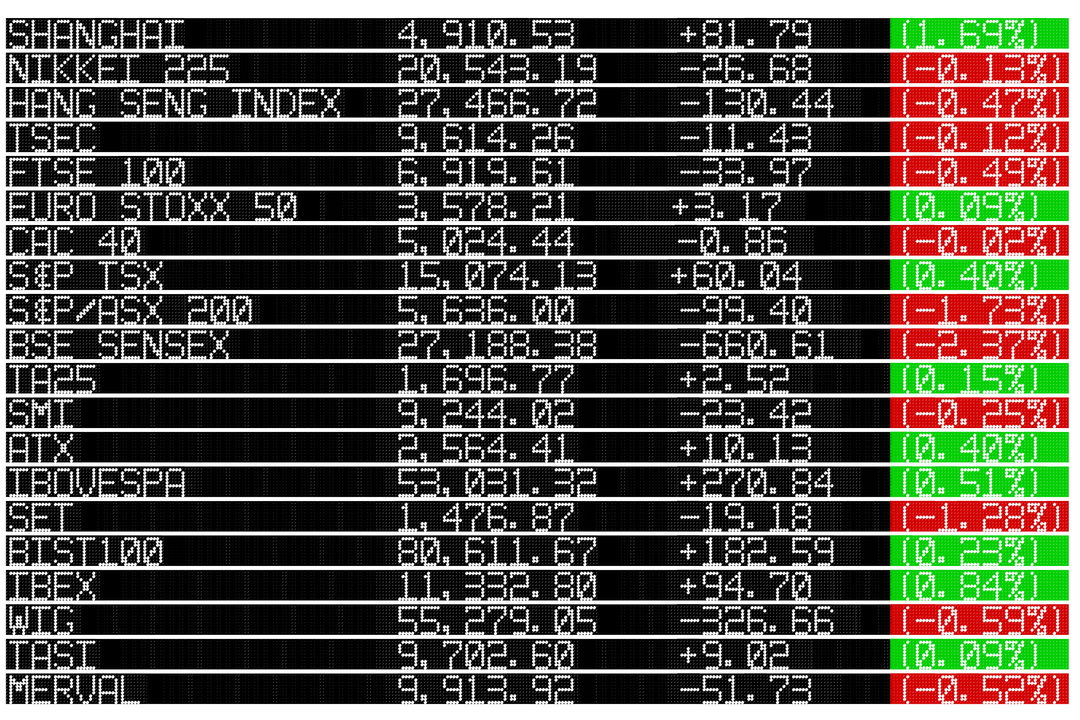
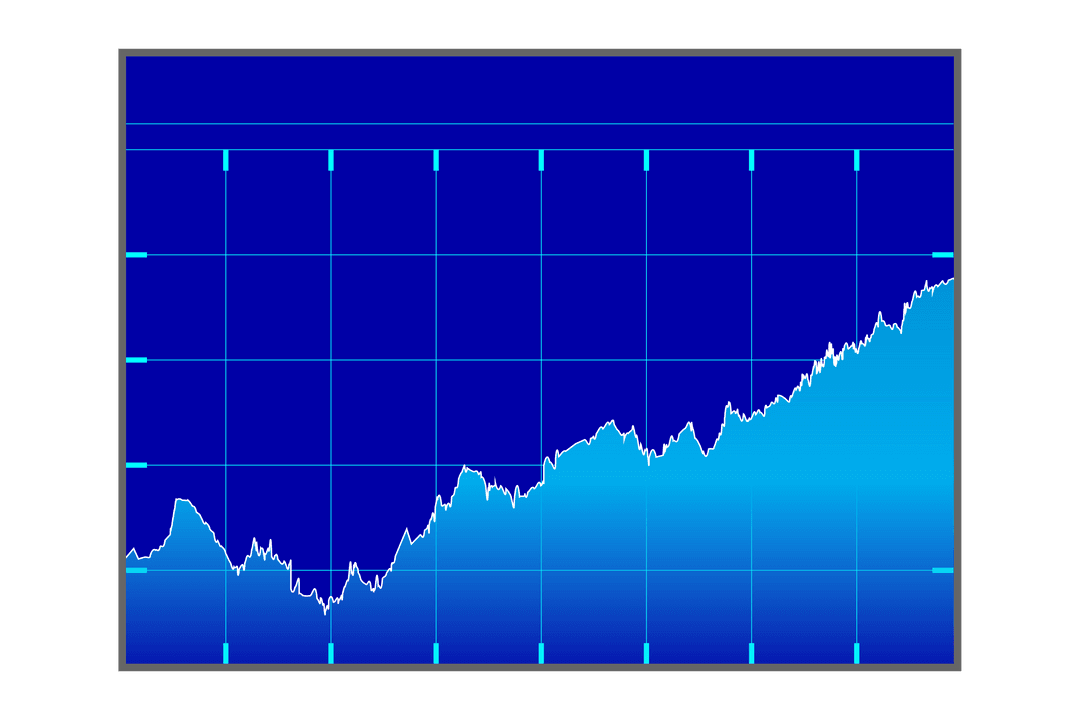
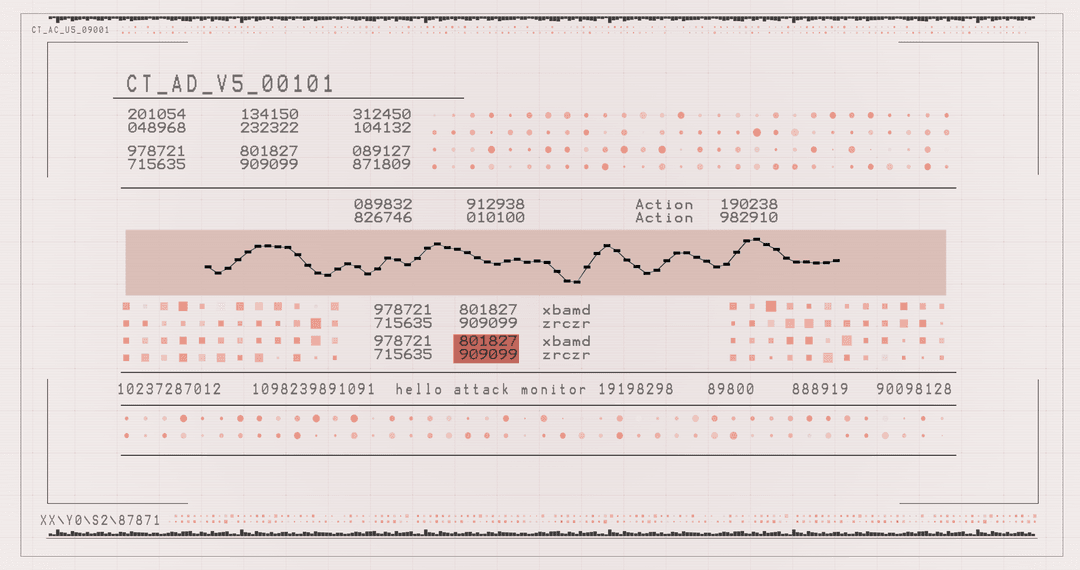
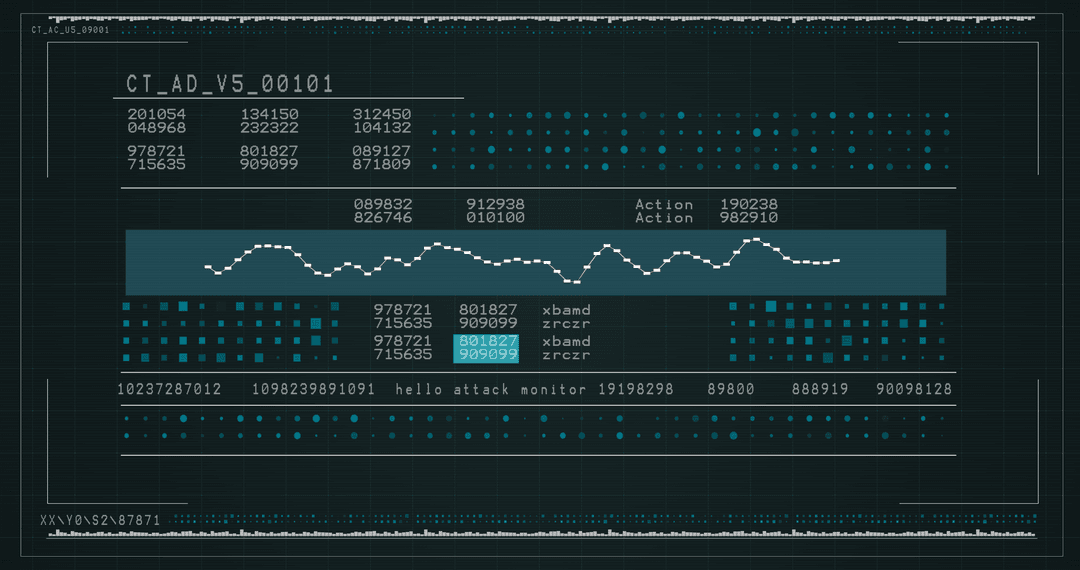
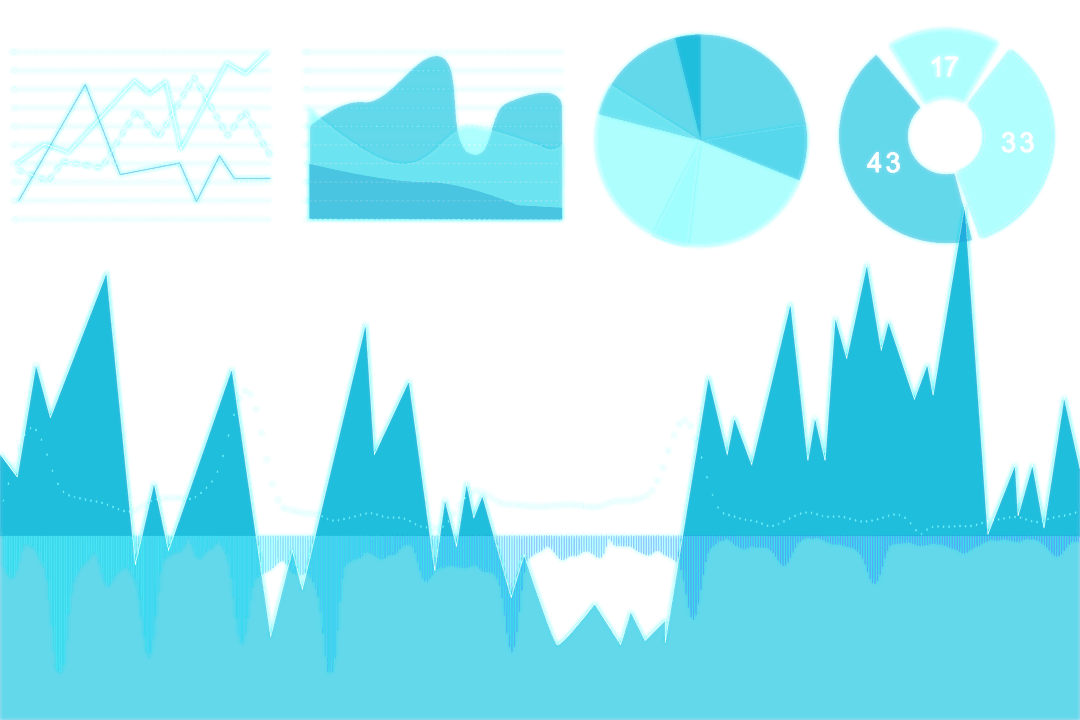
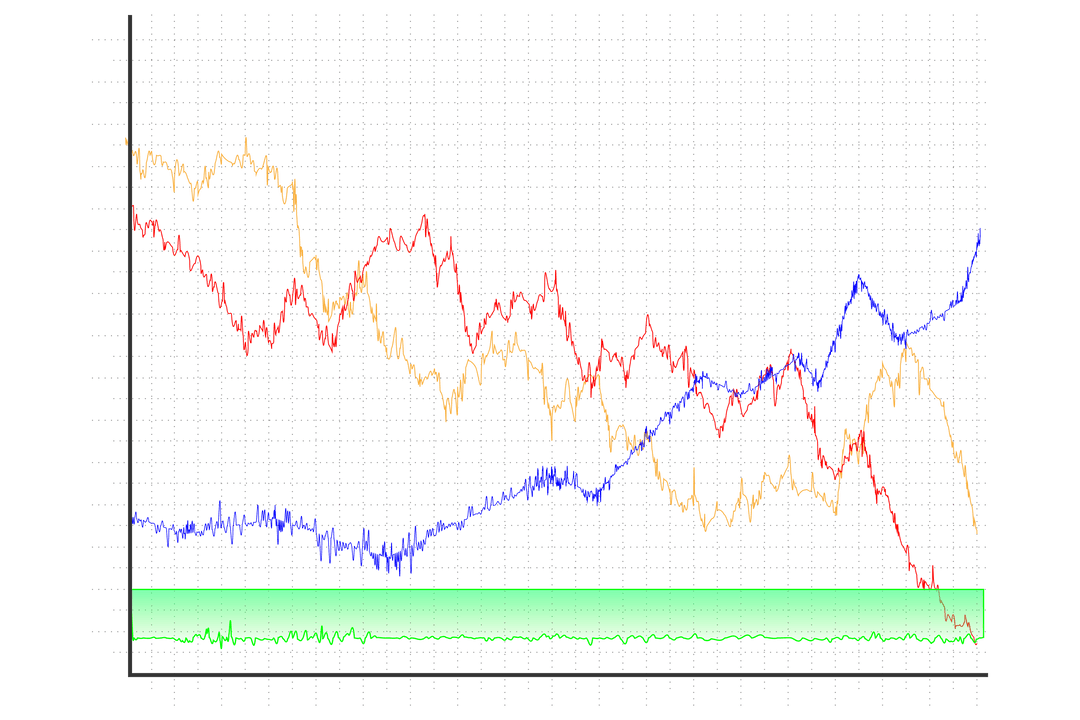
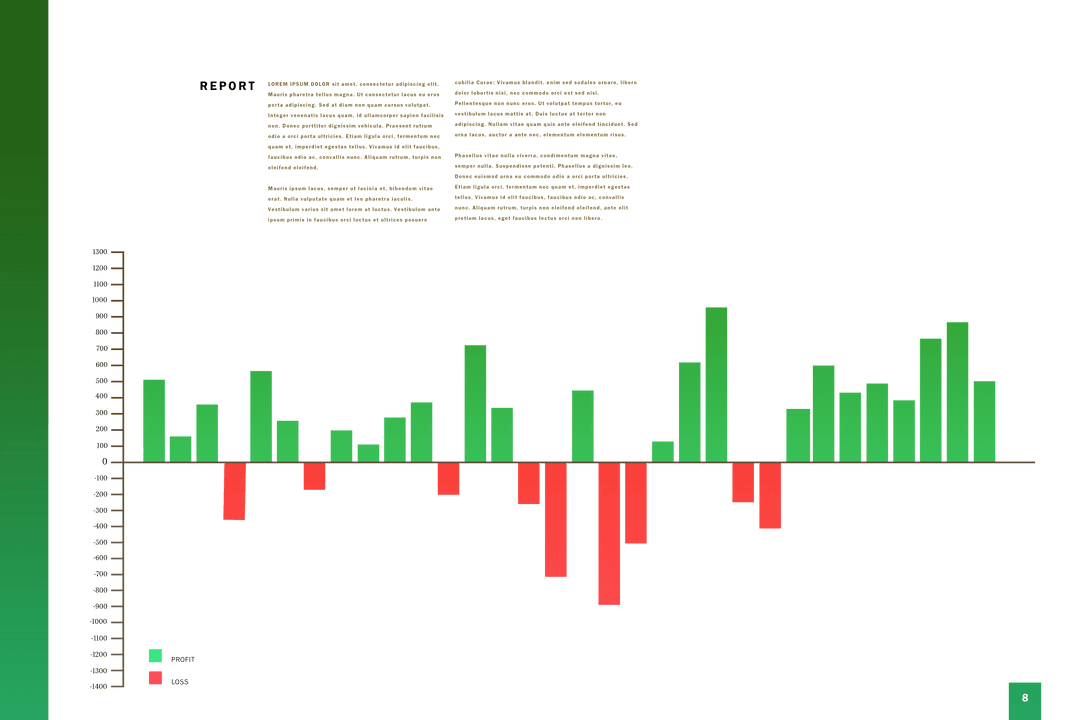
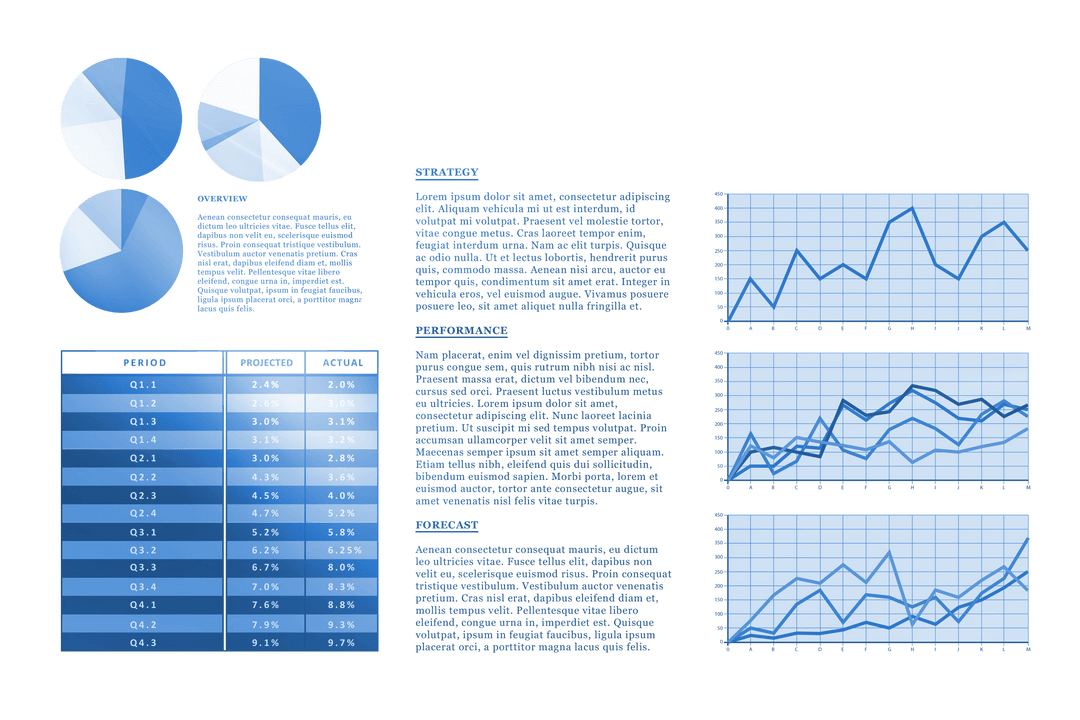
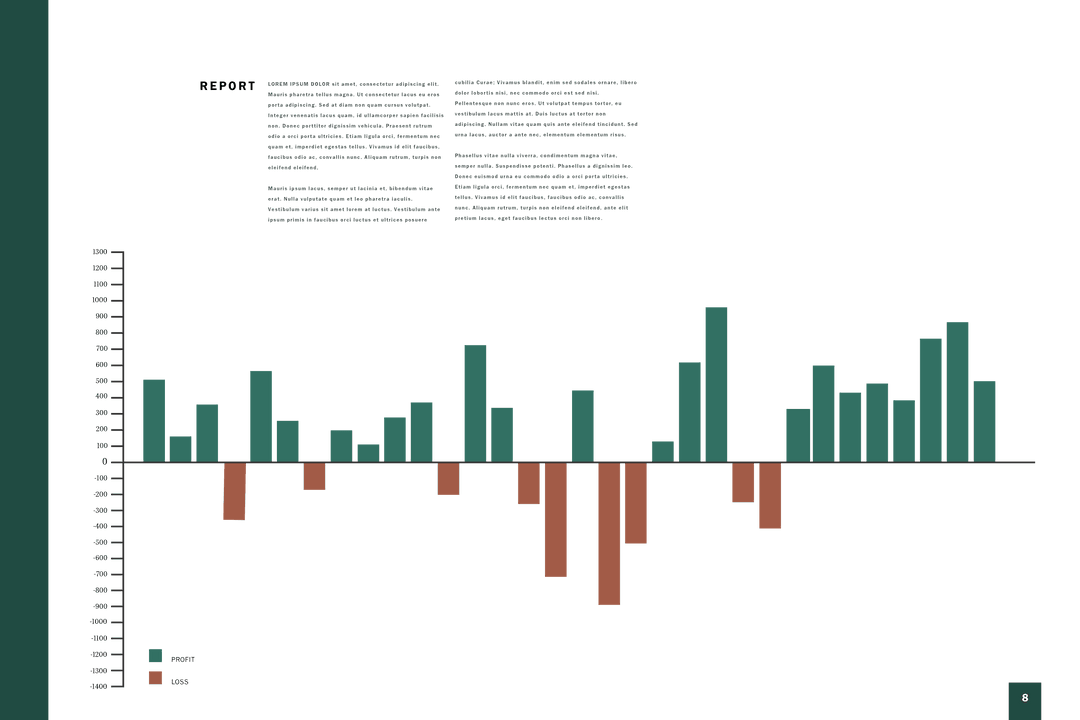
Transparent Digital Stock Market Diagrams and Data Visualization PNG

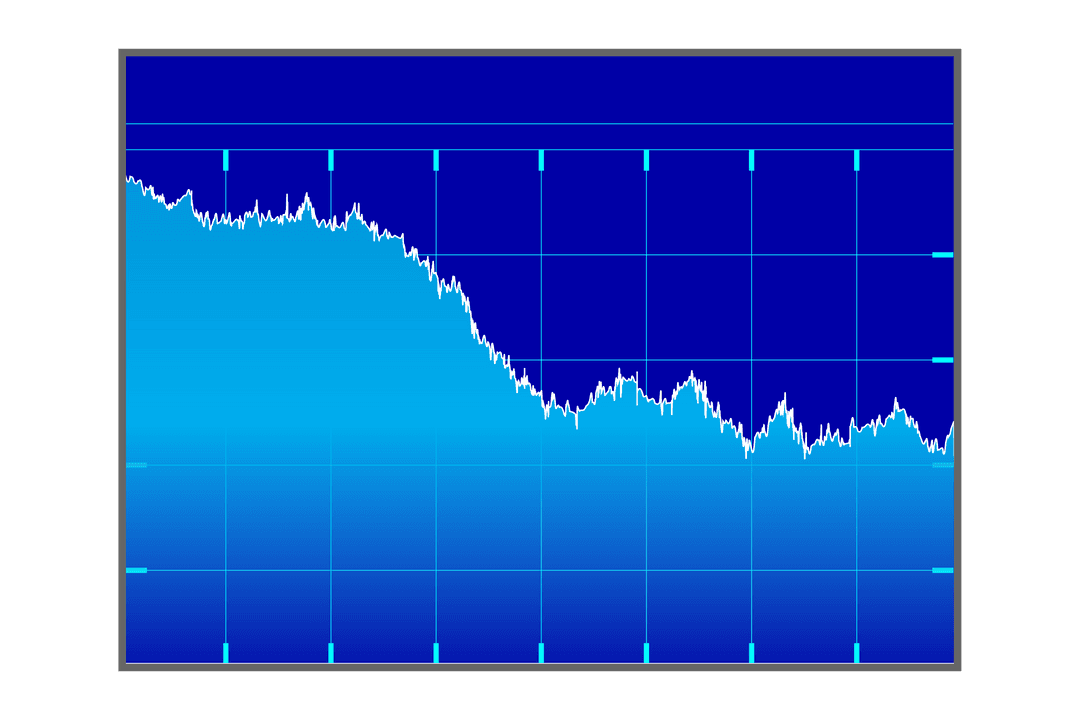
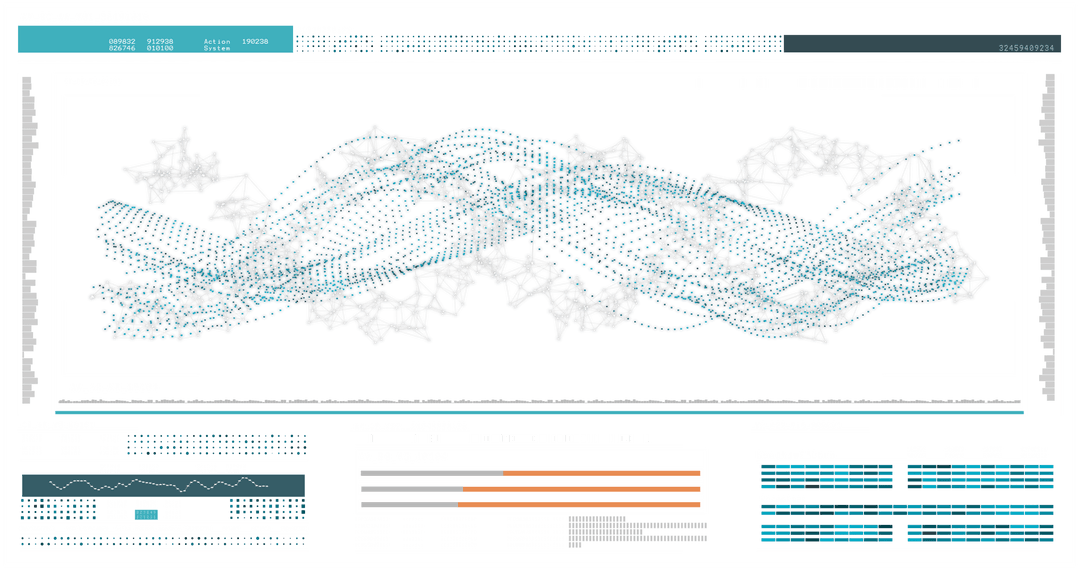
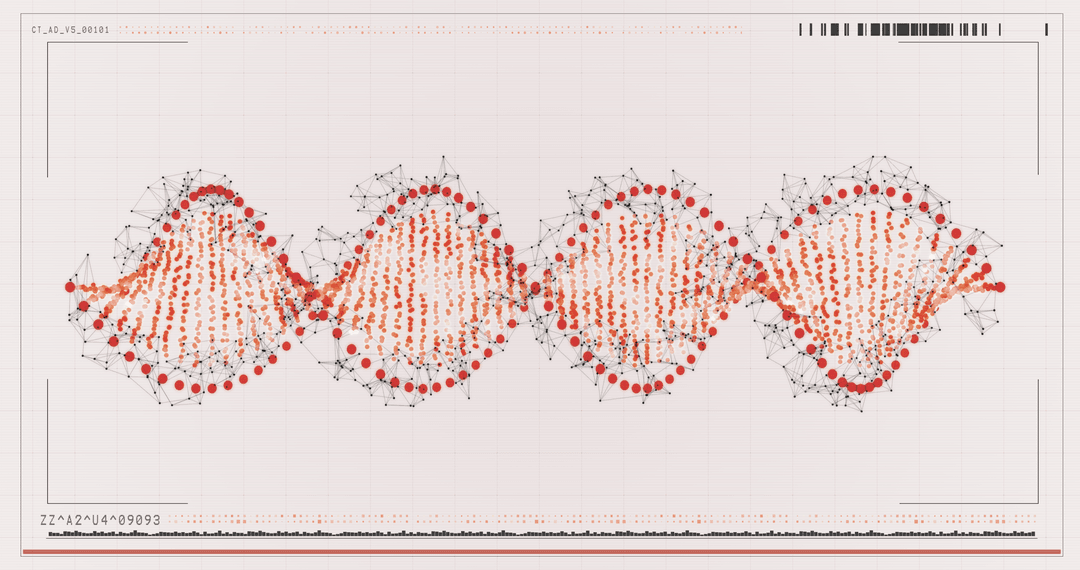
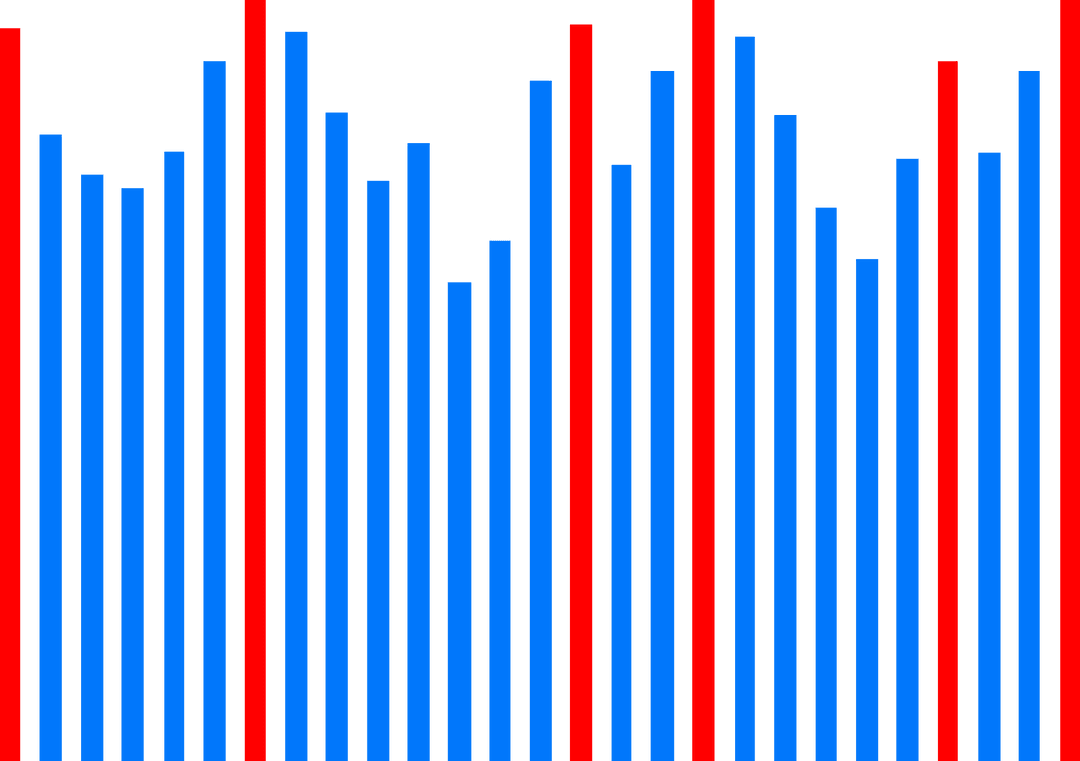
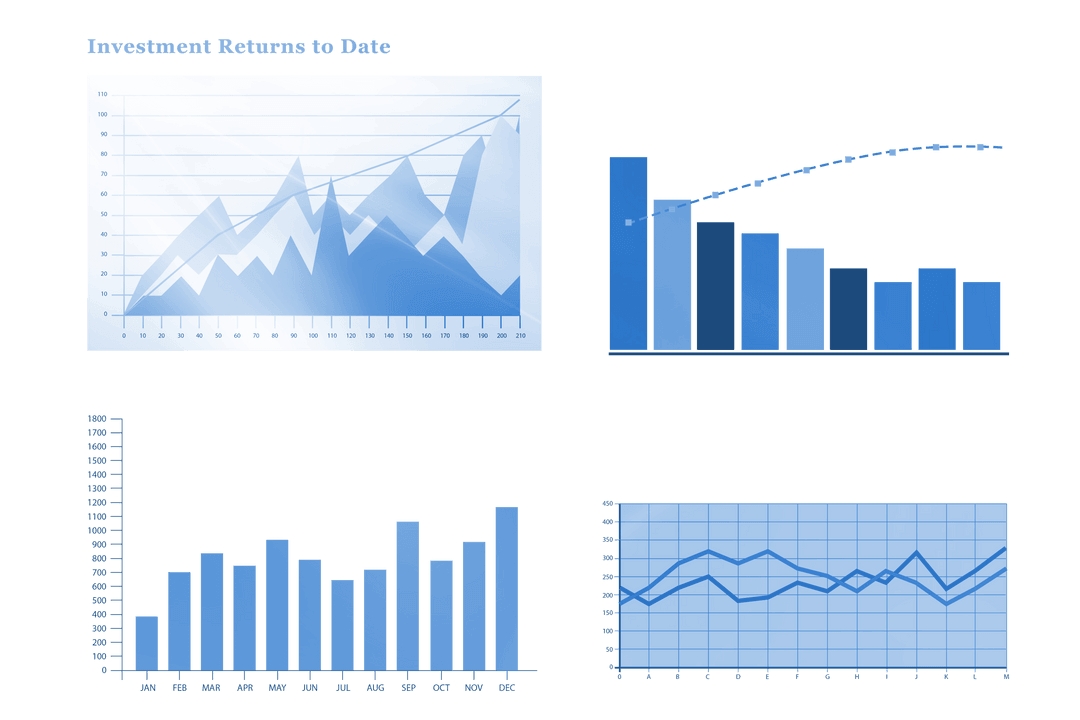
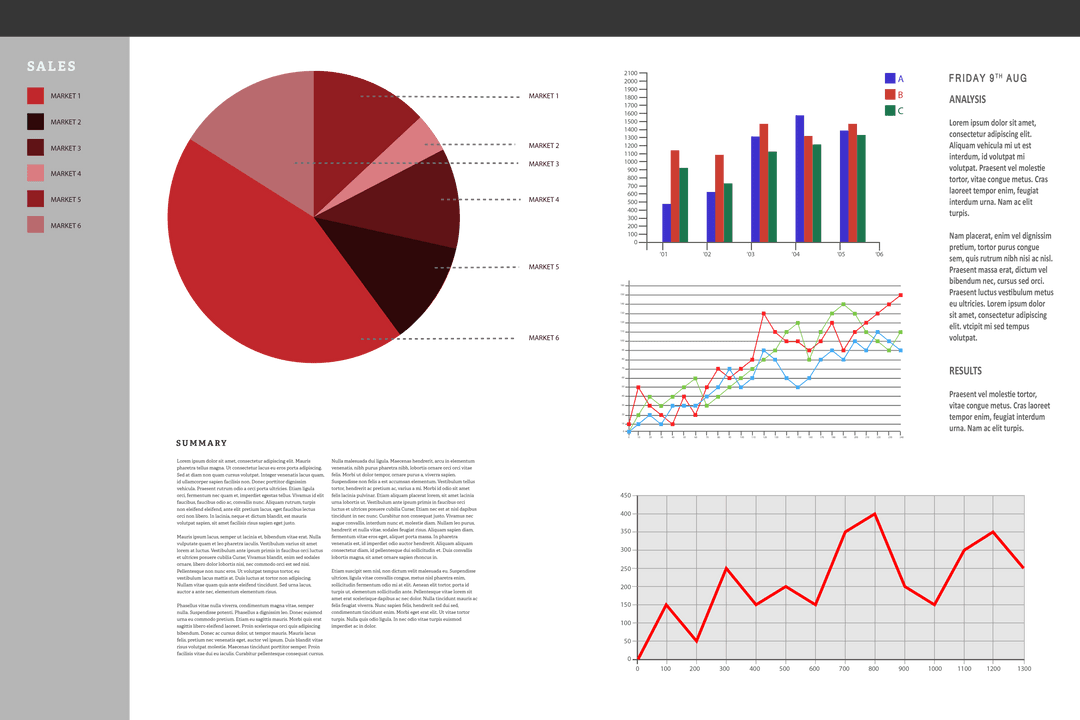
Transparent illustration of stock market data with charts and graphs ideal for financial publications, investment analysis, or educational materials. Can enhance presentations, websites, or reports focused on finance and economics without obstructing other elements.
Powered by  - Get 15% off with code: PIKWIZARD15


0
downloads
downloads
Tags:
More
Credit Photo
If you would like to credit the Photo, here are some ways you can do so
Text Link
png Link
<span class="text-link">
<span>
<a target="_blank" href=https://pikwizard.com/png/transparent-digital-stock-market-diagrams-and-data-visualization/e1a20529e4d41fb71993b4947172c887/>PikWizard</a>
</span>
</span>
<span class="image-link">
<span
style="margin: 0 0 20px 0; display: inline-block; vertical-align: middle; width: 100%;"
>
<a
target="_blank"
href="https://pikwizard.com/png/transparent-digital-stock-market-diagrams-and-data-visualization/e1a20529e4d41fb71993b4947172c887/"
style="text-decoration: none; font-size: 10px; margin: 0;"
>
<img src="https://pikwizard.com/pw/medium/e1a20529e4d41fb71993b4947172c887.png" style="margin: 0; width: 100%;" alt="" />
<p style="font-size: 12px; margin: 0;">PikWizard</p>
</a>
</span>
</span>
Free (free of charge)
Free for personal and commercial use.
Author: Authentic Images
Similar Free PNG Images With Transparent Background
Premium


Premium


Premium


Premium


Premium


Premium


Premium


Premium


Premium


Premium


Premium


Premium


Premium


Premium


Premium

Premium


Premium


Premium


Premium

Premium


Premium


Premium


Premium


Premium
