- Home >
- Stock PNGs >
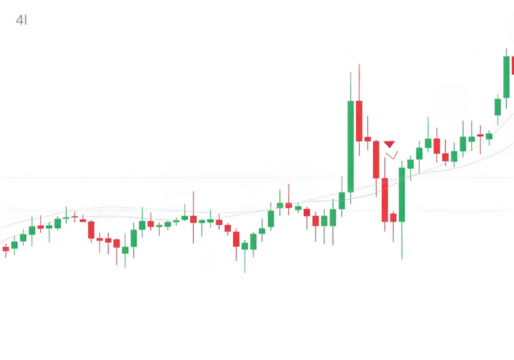
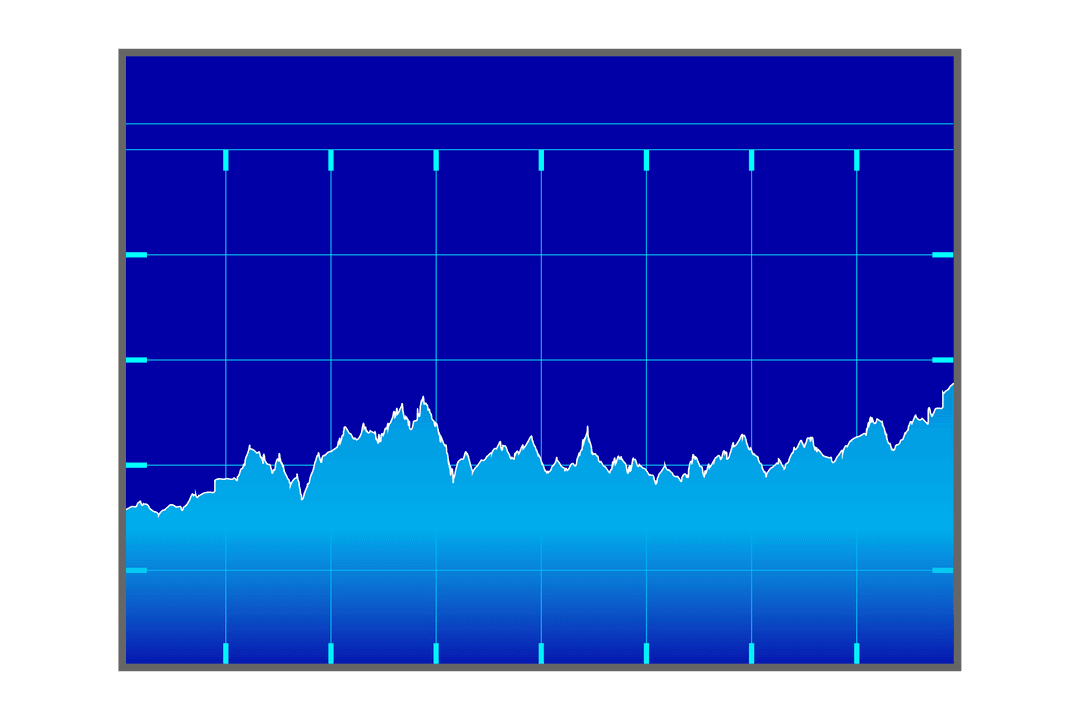
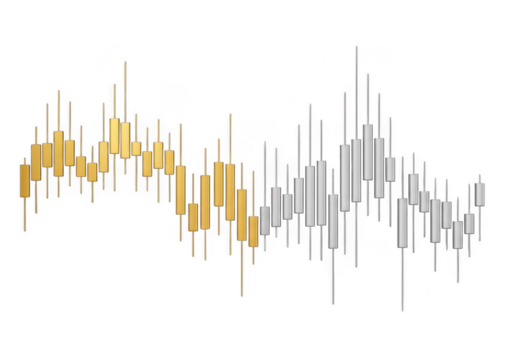
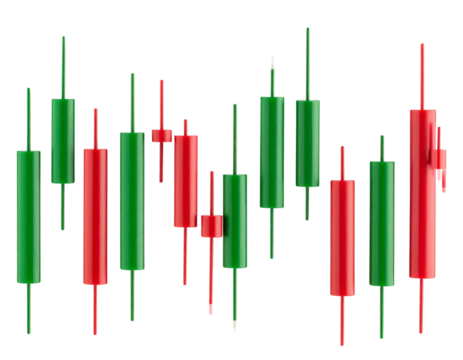
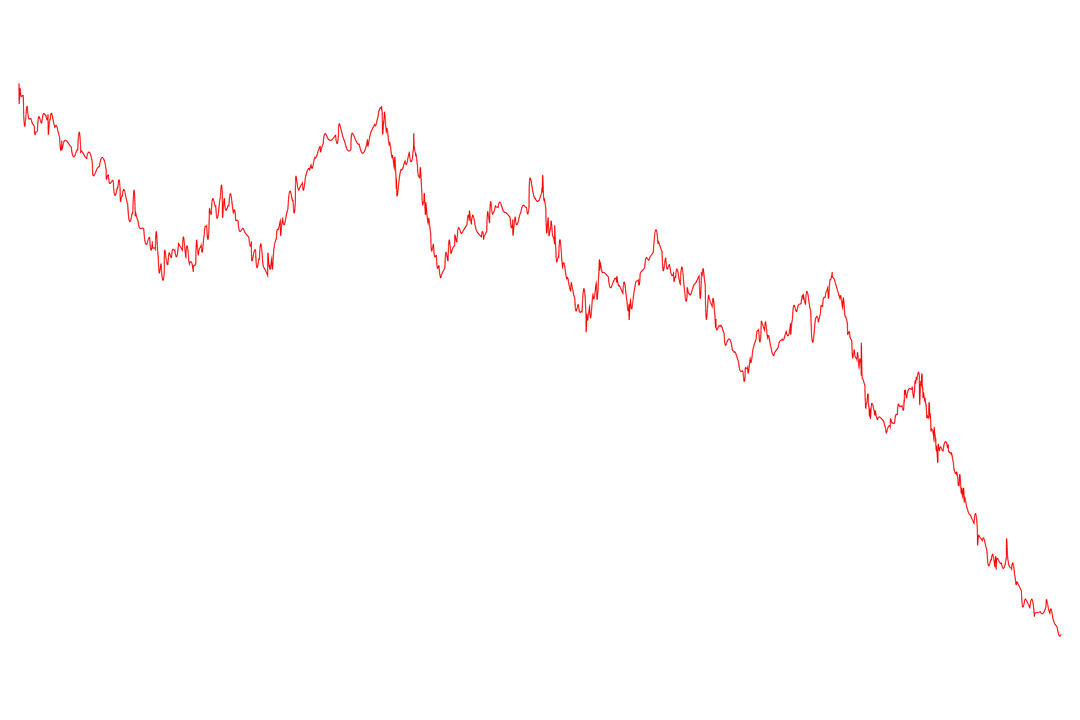
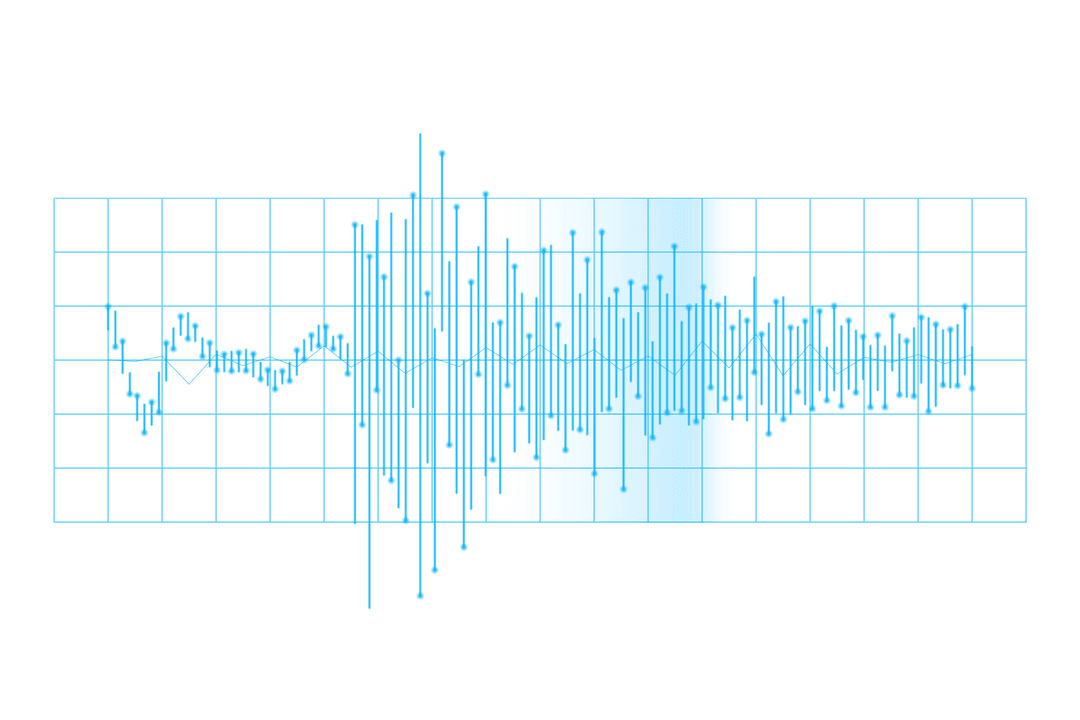
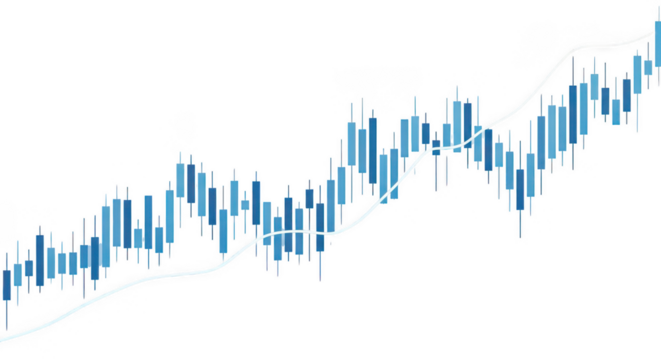
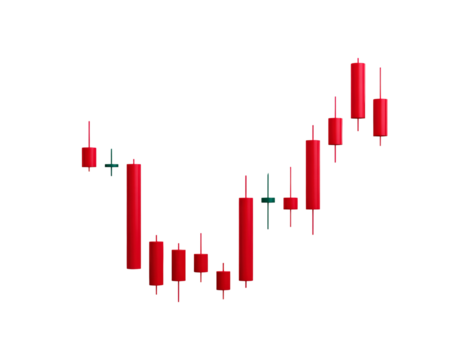
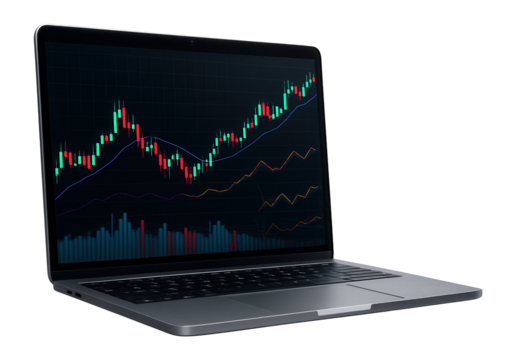
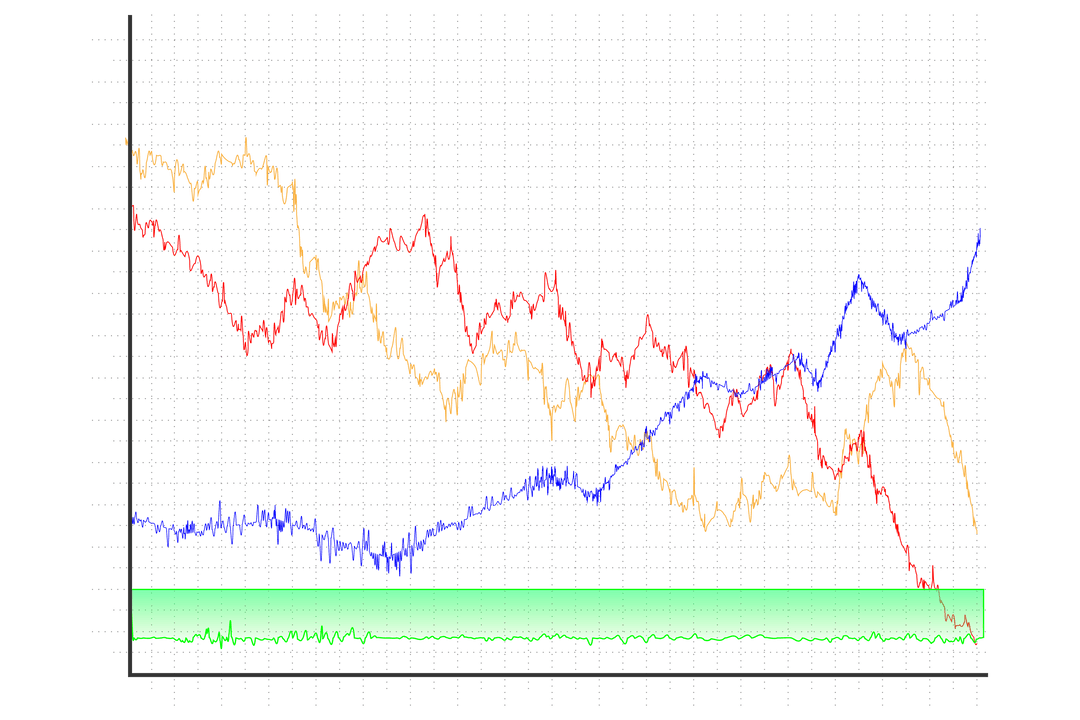
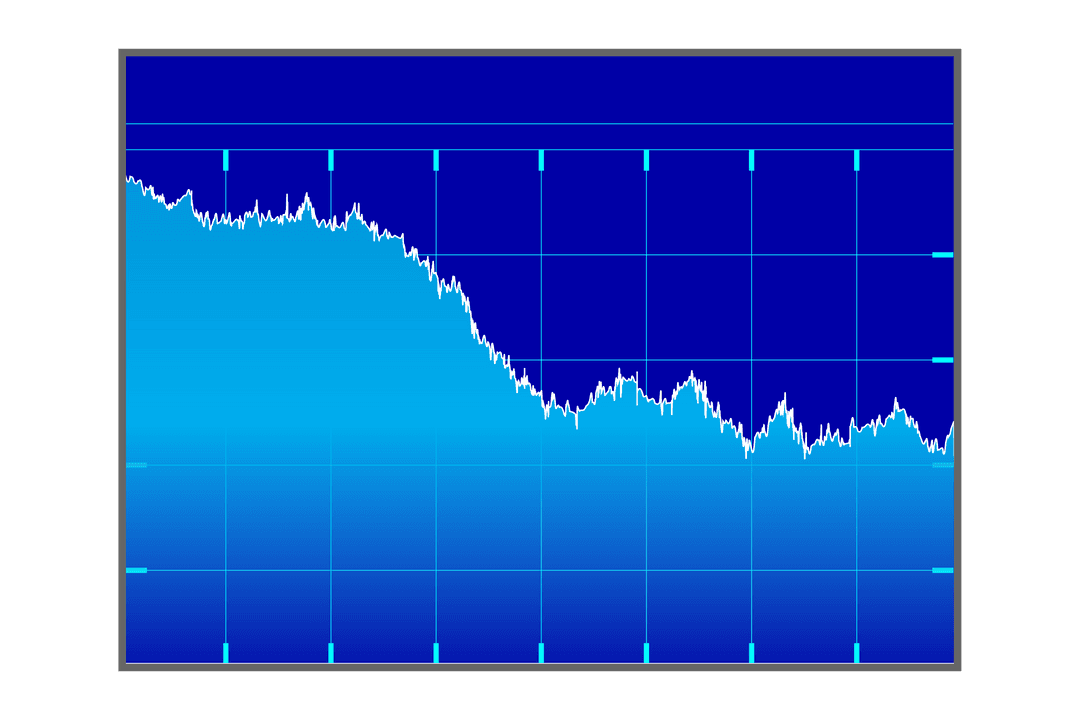
- Transparent Financial Chart with Candlestick and Red Marker on Grid Background
Transparent Financial Chart with Candlestick and Red Marker on Grid Background PNG
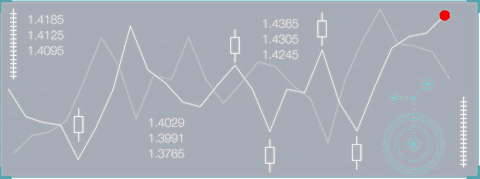
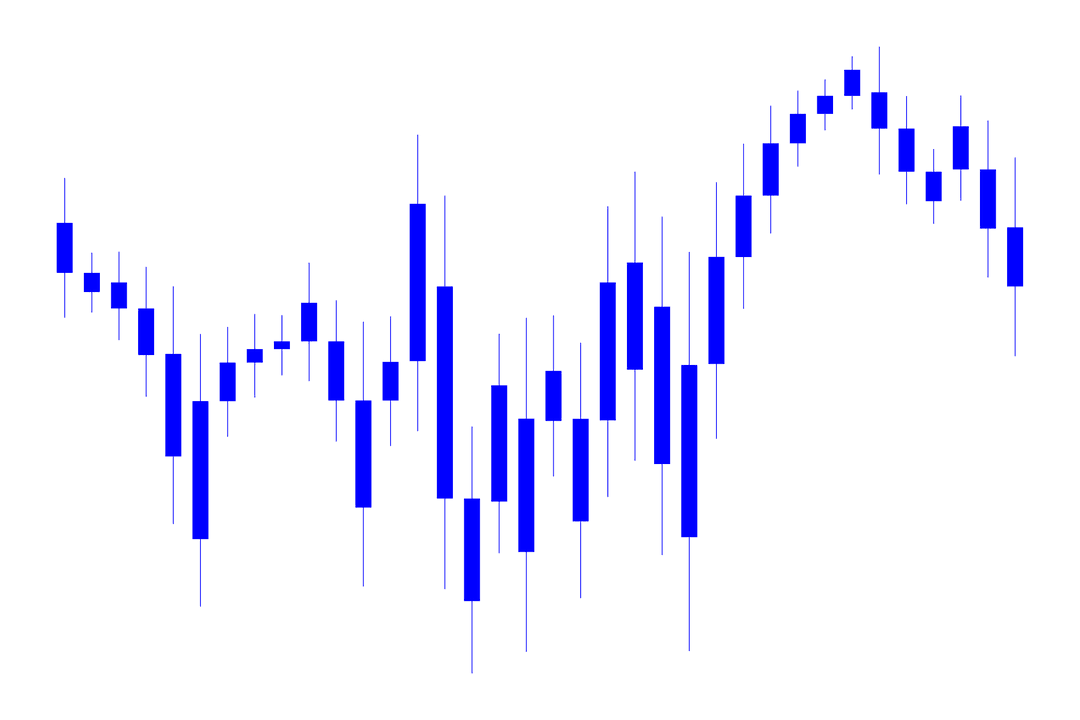
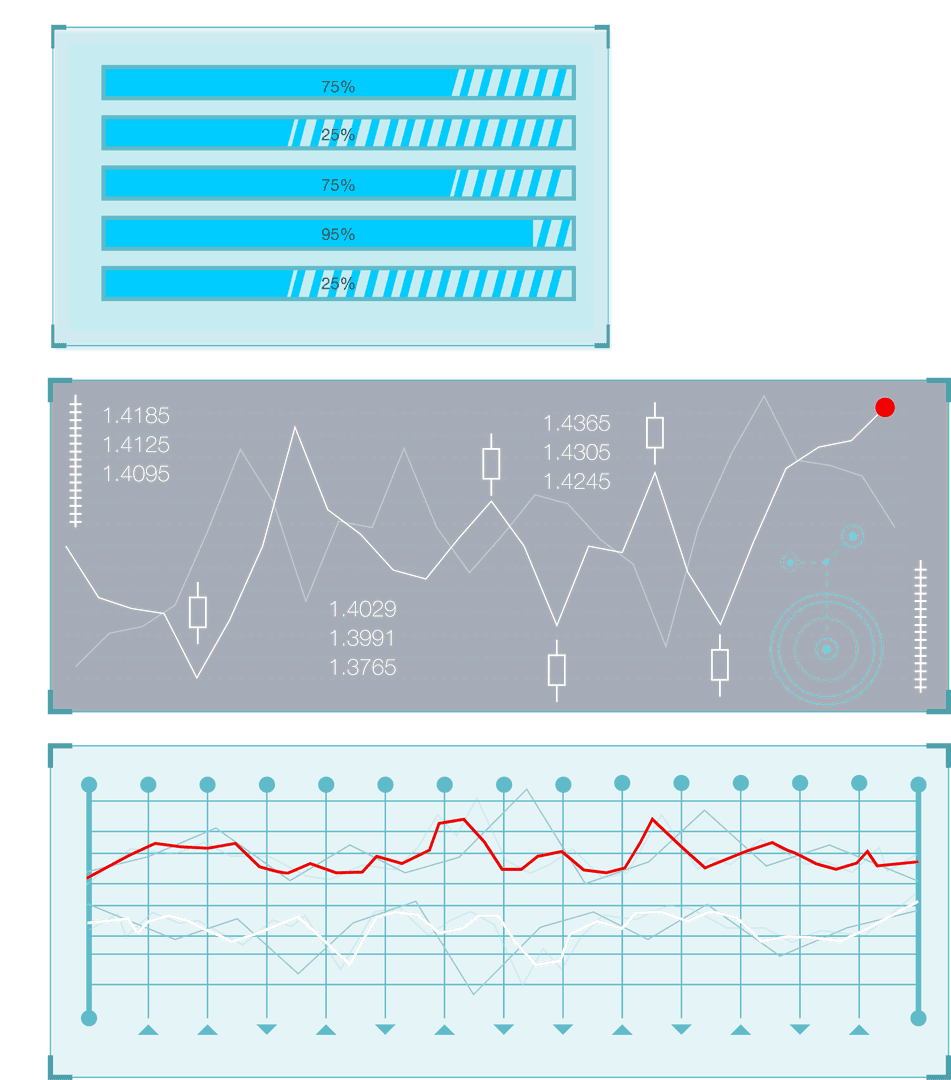
Chart displays in a business or financial presentation to illustrate market trends. Suitable for educational materials about stock market behavior or used as a backdrop for analysis reports. Ability to highlight market highs and successful strategies with corresponding markers.
Powered by 


0
downloads
downloads
Tags:
More
Credit Photo
If you would like to credit the Photo, here are some ways you can do so
Text Link
png Link
<span class="text-link">
<span>
<a target="_blank" href=https://pikwizard.com/png/transparent-financial-chart-with-candlestick-and-red-marker-on-grid-background/90911a9950a3165504d97035561e75ec/>PikWizard</a>
</span>
</span>
<span class="image-link">
<span
style="margin: 0 0 20px 0; display: inline-block; vertical-align: middle; width: 100%;"
>
<a
target="_blank"
href="https://pikwizard.com/png/transparent-financial-chart-with-candlestick-and-red-marker-on-grid-background/90911a9950a3165504d97035561e75ec/"
style="text-decoration: none; font-size: 10px; margin: 0;"
>
<img src="https://pikwizard.com/pw/medium/90911a9950a3165504d97035561e75ec.png" style="margin: 0; width: 100%;" alt="" />
<p style="font-size: 12px; margin: 0;">PikWizard</p>
</a>
</span>
</span>
Free (free of charge)
Free for personal and commercial use.
Author: People Creations
Similar Free PNG Images With Transparent Background
Premium


Premium


Premium


Premium


Premium
Premium


Premium


Premium


Premium


Premium


Premium


Premium


Premium


Premium


Premium


Premium


Premium


Premium


Premium


Premium


Premium


Premium


Premium


Premium