- Home >
- Stock PNGs >
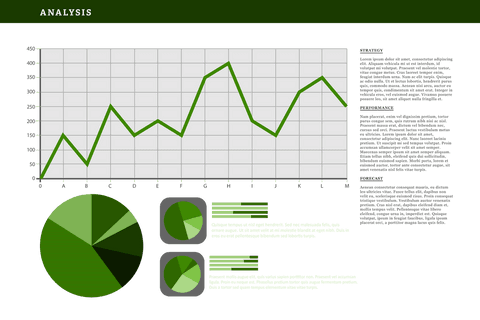
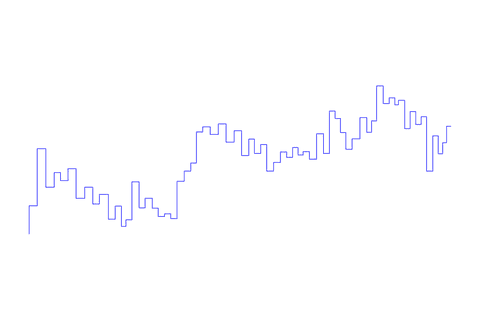
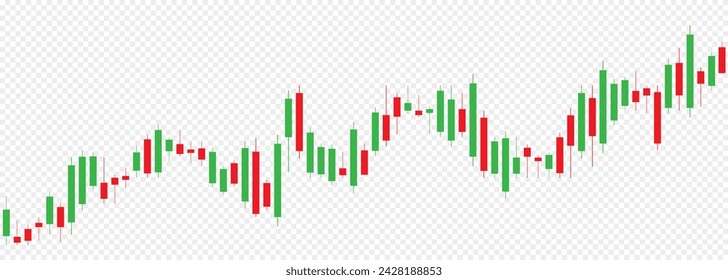
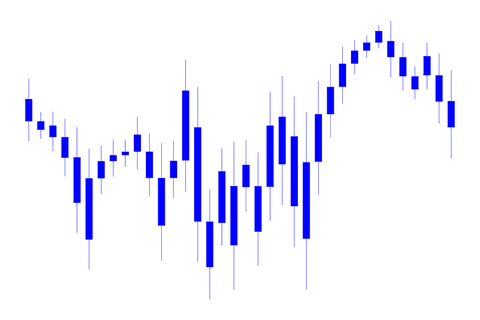
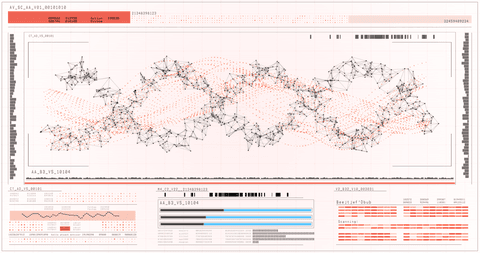
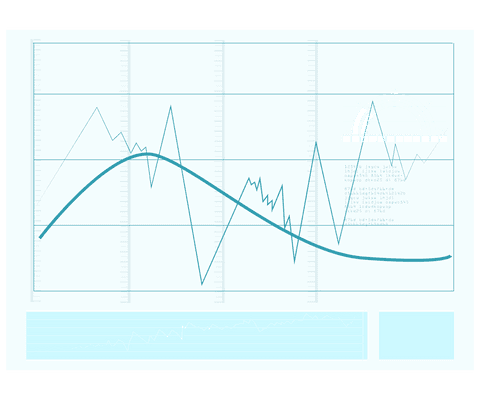
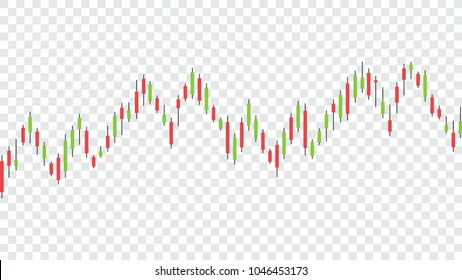
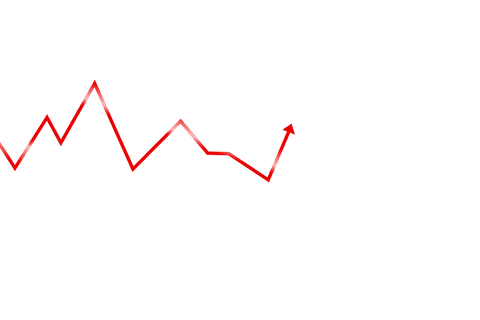
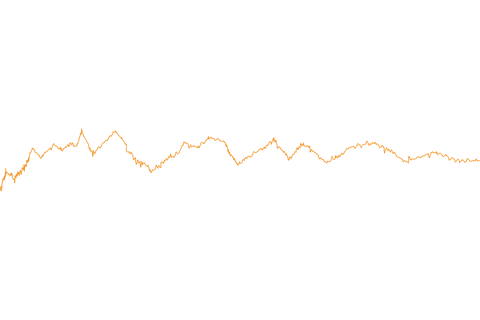
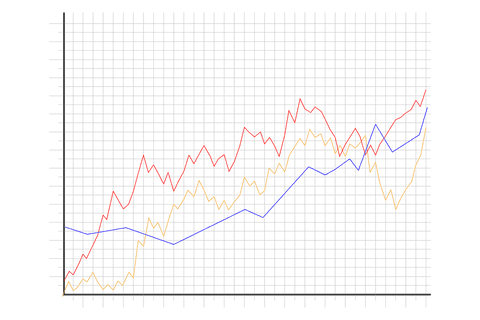
- Transparent Financial Stock Chart with Sharp Statistical Lines
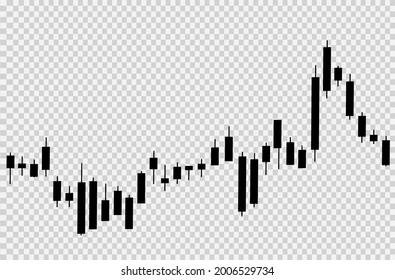
Transparent Financial Stock Chart with Sharp Statistical Lines PNG
Sharp black statistical chart with transparent background illustrates market trends. Versatile for financial presentations, investment analyses, business reports, or economic blogs to depict volatility in markets.
Powered by  - Get 15% off with code: PIKWIZARD15


downloads
Tags:
More
Credit Photo
If you would like to credit the Photo, here are some ways you can do so
Text Link
png Link
<span class="text-link">
<span>
<a target="_blank" href=https://pikwizard.com/png/transparent-financial-stock-chart-with-sharp-statistical-lines/57cb94c4191c0a453309e34b88beb6d6/>PikWizard</a>
</span>
</span>
<span class="image-link">
<span
style="margin: 0 0 20px 0; display: inline-block; vertical-align: middle; width: 100%;"
>
<a
target="_blank"
href="https://pikwizard.com/png/transparent-financial-stock-chart-with-sharp-statistical-lines/57cb94c4191c0a453309e34b88beb6d6/"
style="text-decoration: none; font-size: 10px; margin: 0;"
>
<img src="https://pikwizard.com/pw/medium/57cb94c4191c0a453309e34b88beb6d6.png" style="margin: 0; width: 100%;" alt="" />
<p style="font-size: 12px; margin: 0;">PikWizard</p>
</a>
</span>
</span>
Free (free of charge)
Free for personal and commercial use.
Author: People Creations
Similar Free PNG Images With Transparent Background
Loading...


Premium


Premium

Premium


Premium


Premium


Premium

Premium


Premium

Premium


Premium


Premium


Premium


Premium

Premium


Premium
Premium


Premium


Premium

Premium


Premium


Premium
Premium


Premium

Premium


Premium