- Home >
- Stock PNGs >
- Transparent Graph Illustration Showing Comparison of Values
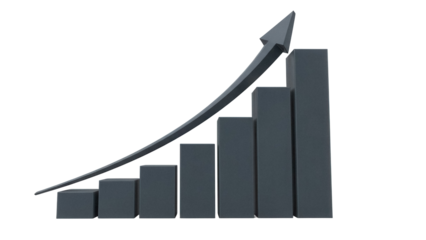
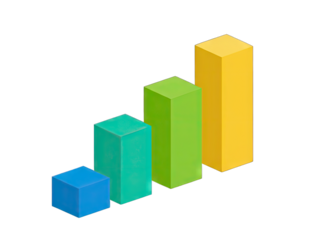
Transparent Graph Illustration Showing Comparison of Values PNG
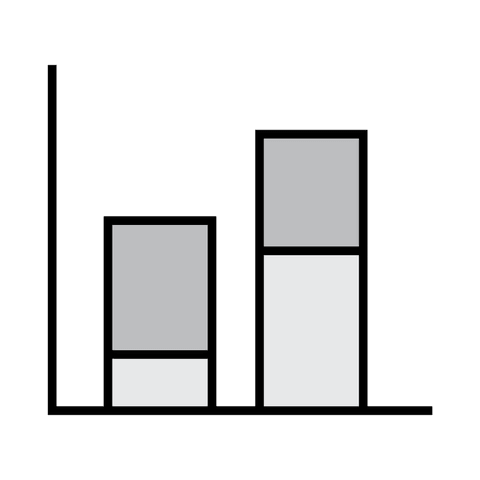
This transparent bar graph illustration highlights a simple stacked design for easy comparison of values using gray shades. Perfect for presentations, business reports, or educational materials where illustration of statistical, financial, or data analysis is required.
Powered by 


downloads
Tags:
More
Credit Photo
If you would like to credit the Photo, here are some ways you can do so
Text Link
png Link
<span class="text-link">
<span>
<a target="_blank" href=https://pikwizard.com/png/transparent-graph-illustration-showing-comparison-of-values/cd4f720a7f0c66f0e1776b8c1519cbea/>PikWizard</a>
</span>
</span>
<span class="image-link">
<span
style="margin: 0 0 20px 0; display: inline-block; vertical-align: middle; width: 100%;"
>
<a
target="_blank"
href="https://pikwizard.com/png/transparent-graph-illustration-showing-comparison-of-values/cd4f720a7f0c66f0e1776b8c1519cbea/"
style="text-decoration: none; font-size: 10px; margin: 0;"
>
<img src="https://pikwizard.com/pw/medium/cd4f720a7f0c66f0e1776b8c1519cbea.png" style="margin: 0; width: 100%;" alt="" />
<p style="font-size: 12px; margin: 0;">PikWizard</p>
</a>
</span>
</span>
Free (free of charge)
Free for personal and commercial use.
Author: People Creations
Similar Free PNG Images With Transparent Background
Loading...

Premium


Premium


Premium


Premium


Premium


Premium


Premium


Premium


Premium


Premium


Premium


Premium


Premium


Premium


Premium


Premium
Premium


Premium


Premium


Premium


Premium


Premium


Premium


Premium


Premium