- Home >
- Stock PNGs >
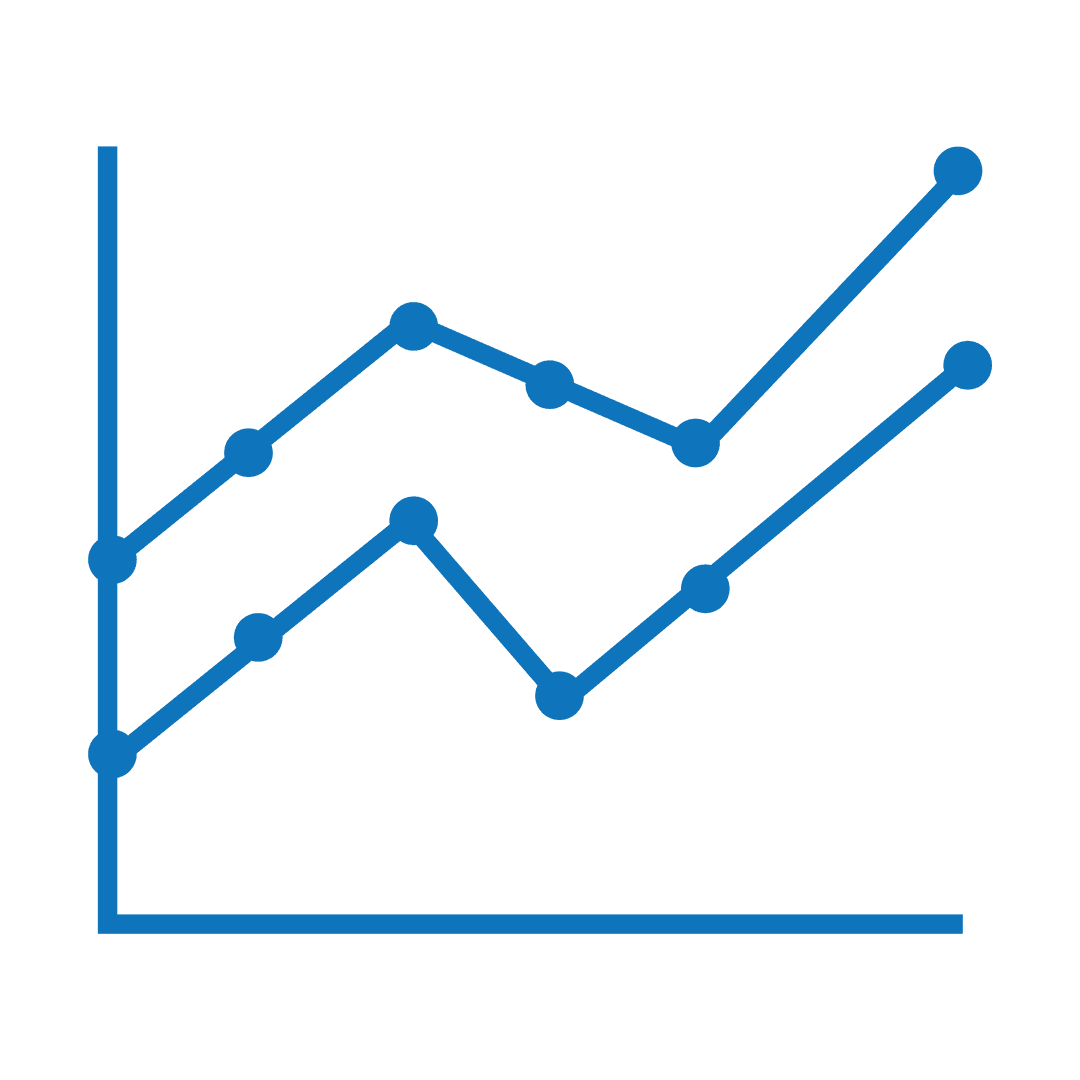
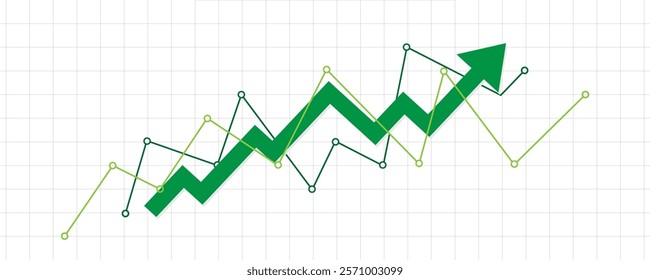
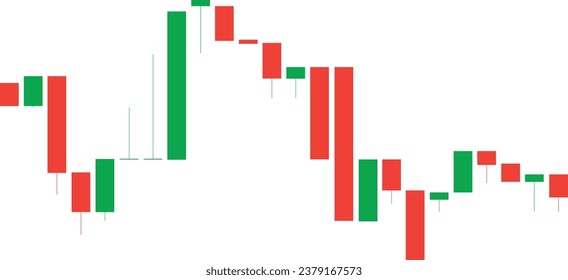
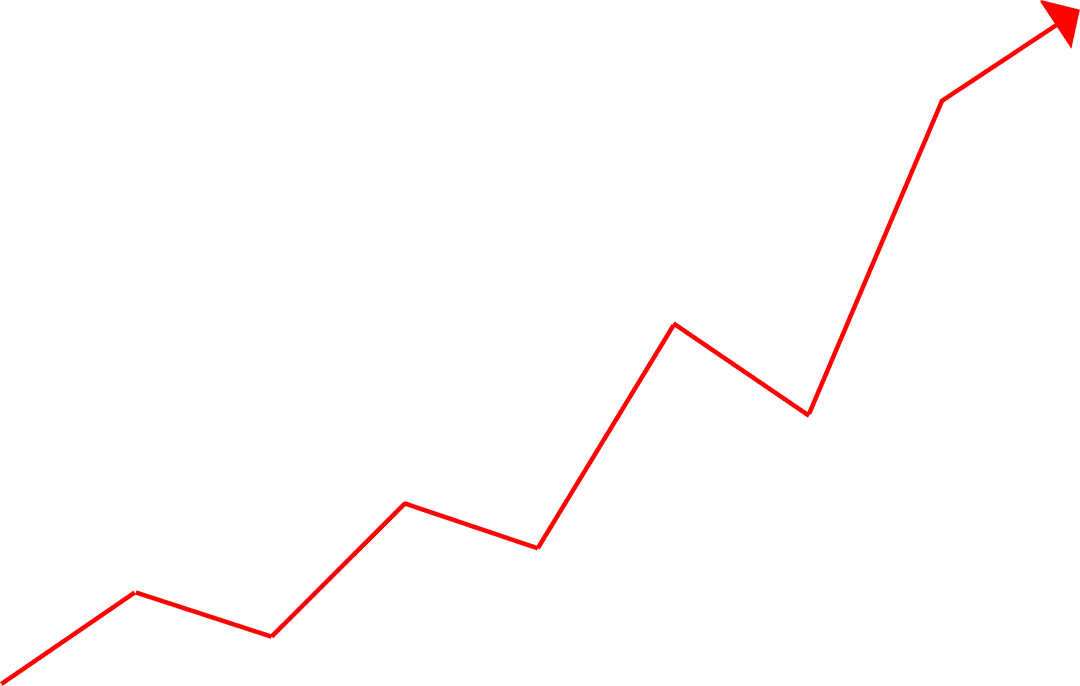
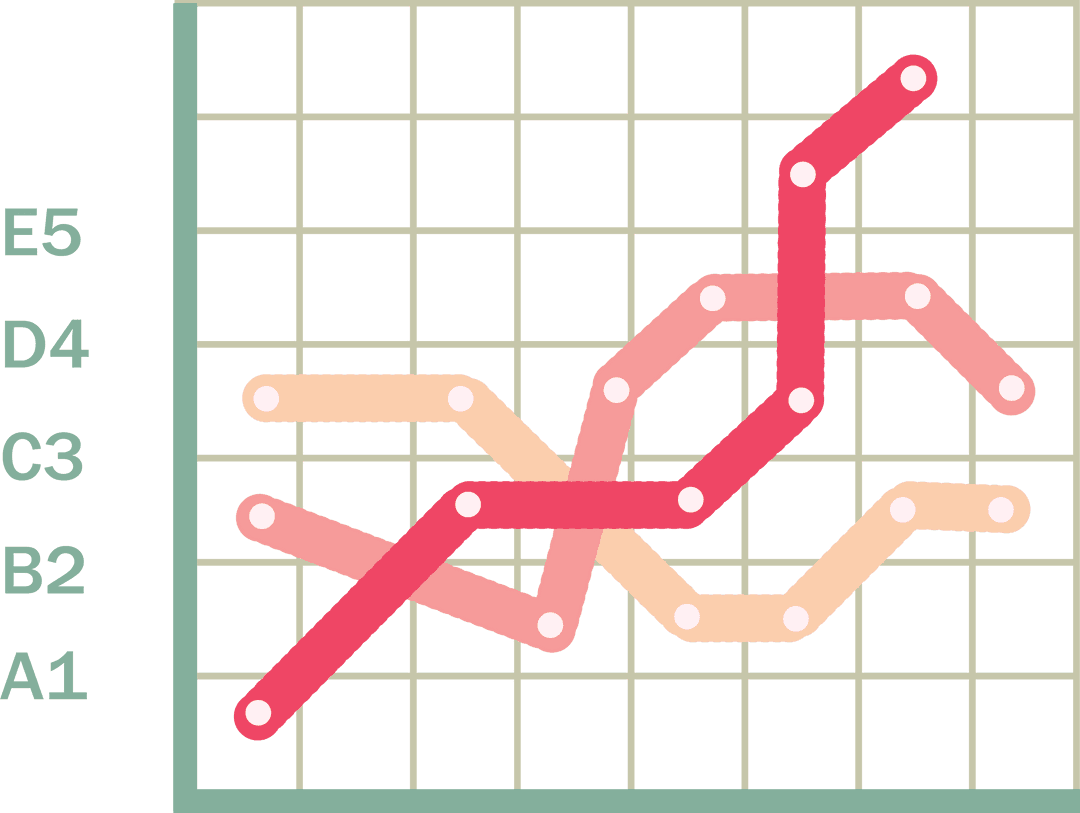
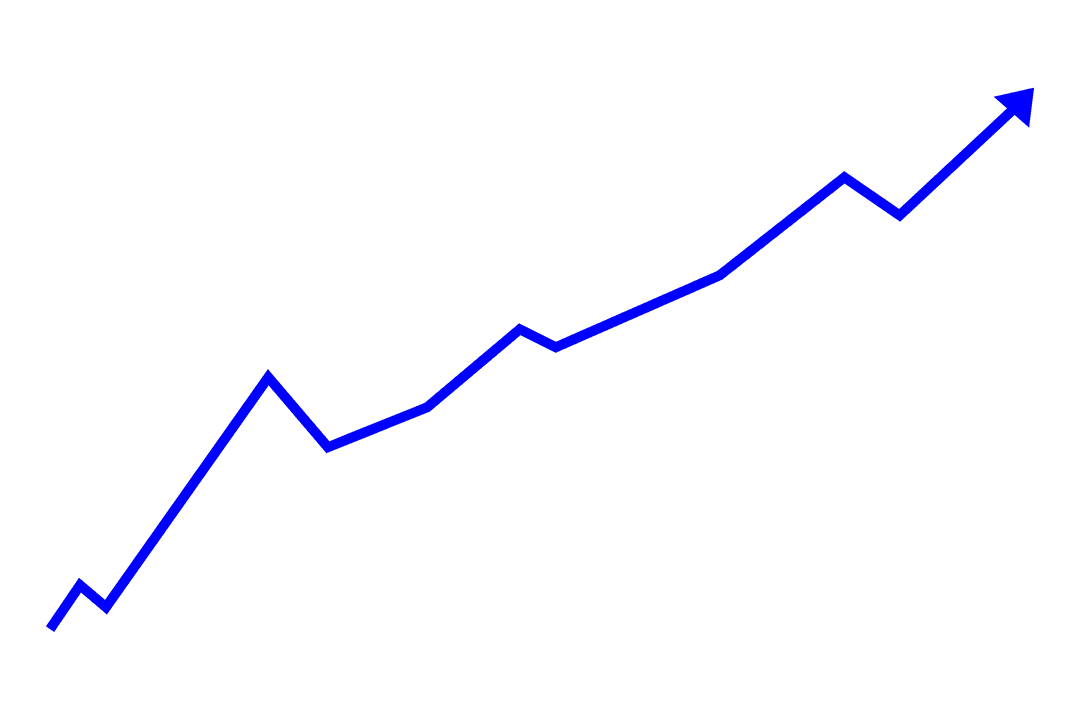
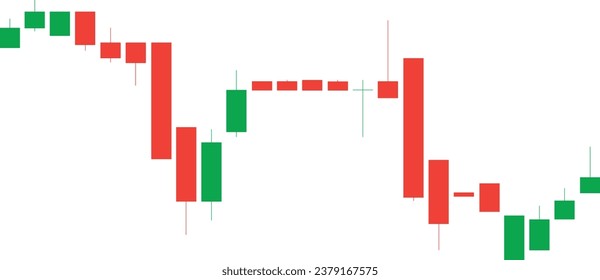
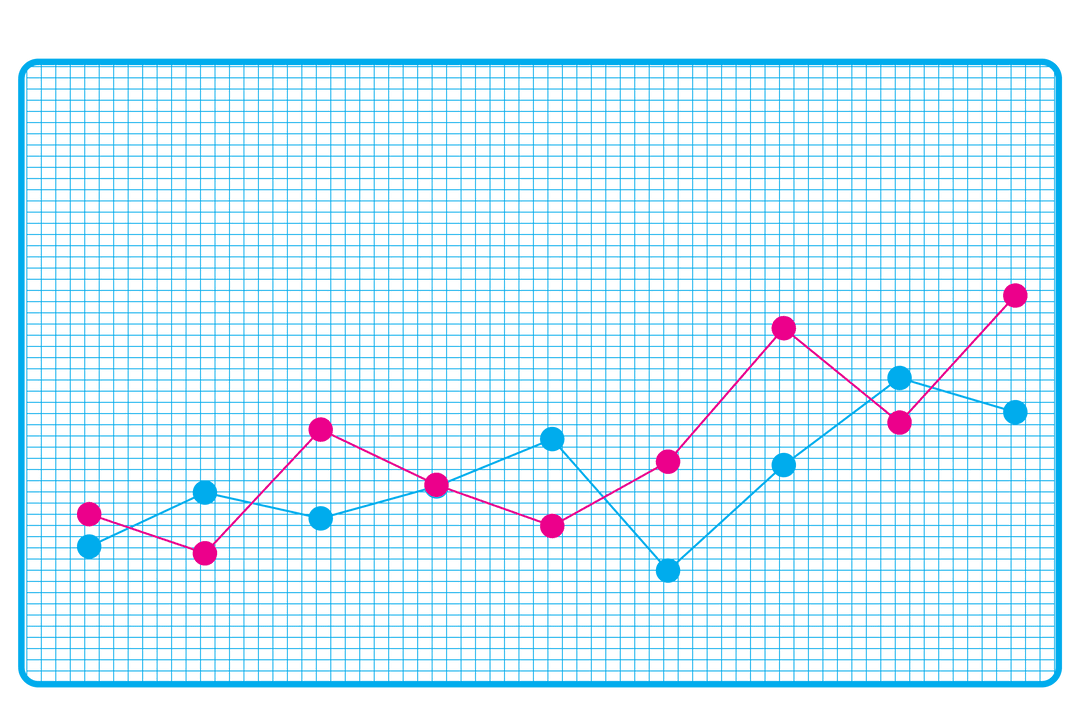
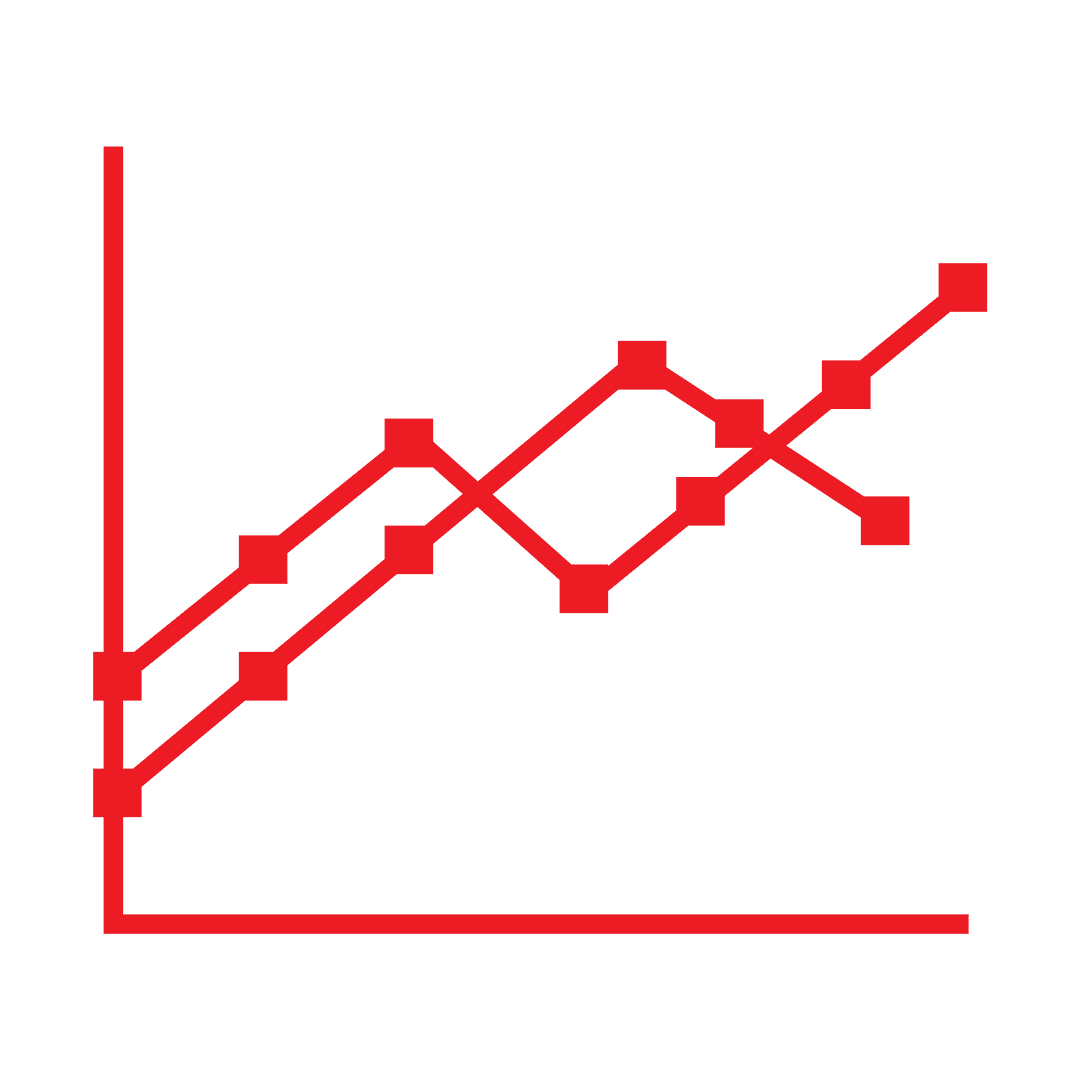
- Transparent Green Line Chart Illustrating Data Analysis Trends
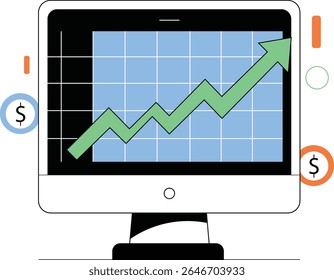
Transparent Green Line Chart Illustrating Data Analysis Trends PNG

Digitally created transparent green line chart illustrating different data trend lines. Useful for presentations, business analytics, and infographics where showcasing statistical progress in a visual manner is needed. Fits well into corporate communications and financial reports to highlight trends such as growth, development, and statistics analysis.
Powered by  - Get 15% off with code: PIKWIZARD15


2
downloads
downloads
Tags:
More
Credit Photo
If you would like to credit the Photo, here are some ways you can do so
Text Link
png Link
<span class="text-link">
<span>
<a target="_blank" href=https://pikwizard.com/png/transparent-green-line-chart-illustrating-data-analysis-trends/b1be704386ecf54c64e606381c3e3e27/>PikWizard</a>
</span>
</span>
<span class="image-link">
<span
style="margin: 0 0 20px 0; display: inline-block; vertical-align: middle; width: 100%;"
>
<a
target="_blank"
href="https://pikwizard.com/png/transparent-green-line-chart-illustrating-data-analysis-trends/b1be704386ecf54c64e606381c3e3e27/"
style="text-decoration: none; font-size: 10px; margin: 0;"
>
<img src="https://pikwizard.com/pw/medium/b1be704386ecf54c64e606381c3e3e27.png" style="margin: 0; width: 100%;" alt="" />
<p style="font-size: 12px; margin: 0;">PikWizard</p>
</a>
</span>
</span>
Free (free of charge)
Free for personal and commercial use.
Author: People Creations
Similar Free PNG Images With Transparent Background

Premium


Premium


Premium


Premium


Premium


Premium


Premium


Premium


Premium


Premium


Premium


Premium


Premium


Premium


Premium


Premium


Premium


Premium


Premium


Premium


Premium


Premium


Premium