- Home >
- Stock PNGs >
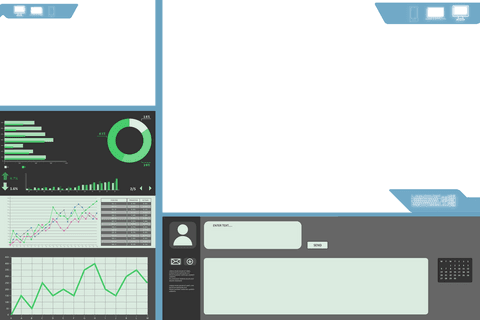
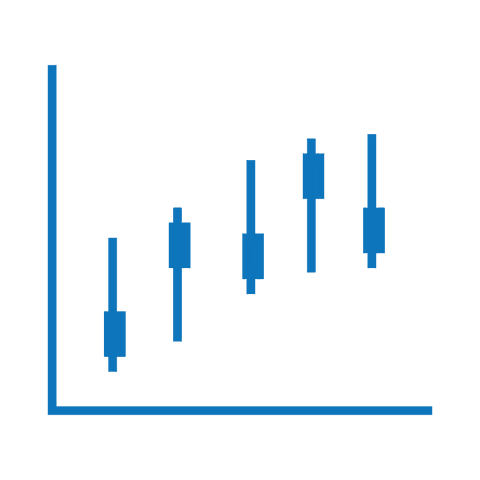
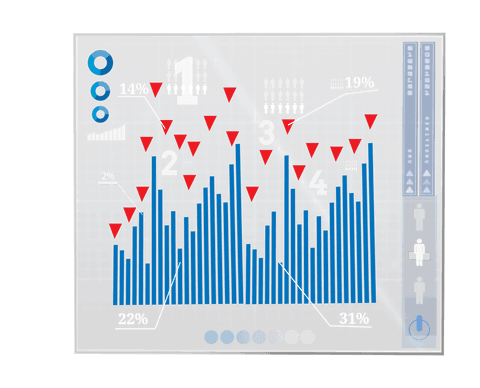
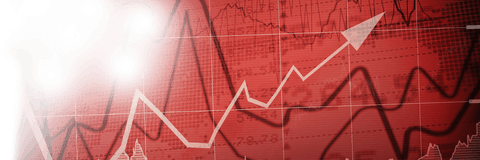
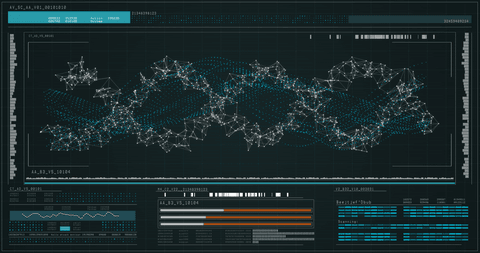
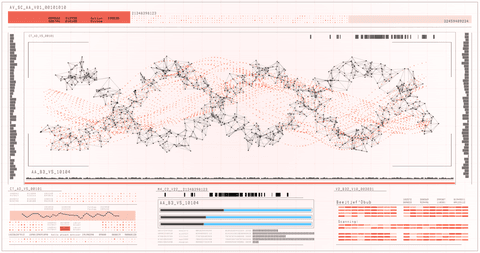
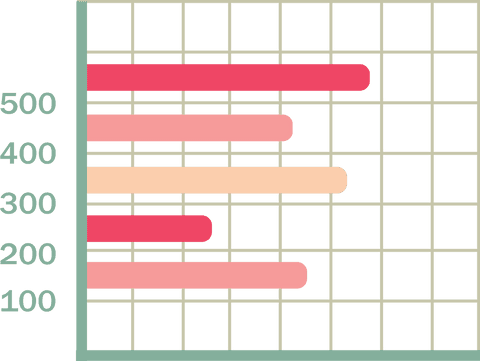
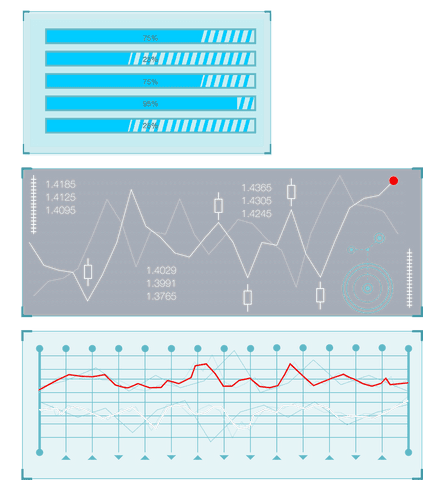
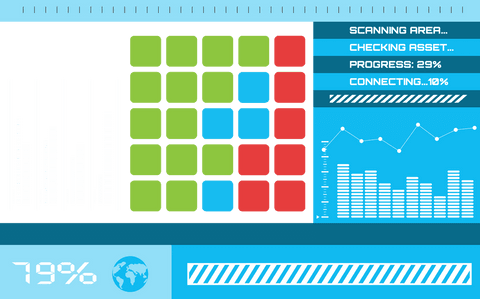
- Transparent Performance Levels Chart with Bars and Progress Bars
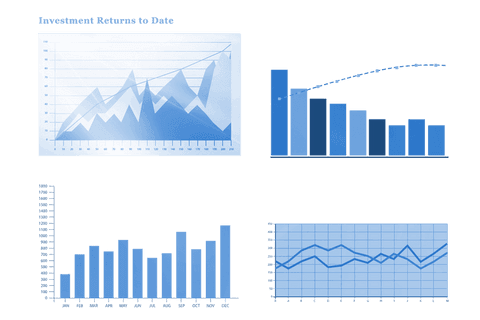
Transparent Performance Levels Chart with Bars and Progress Bars PNG
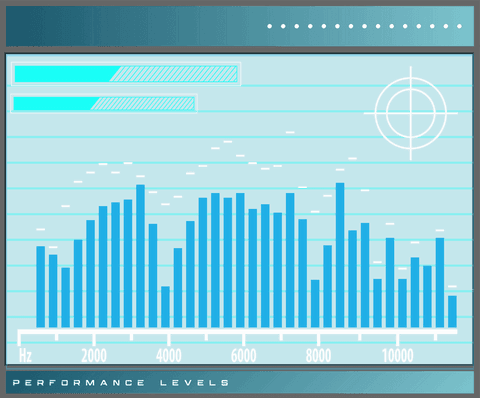
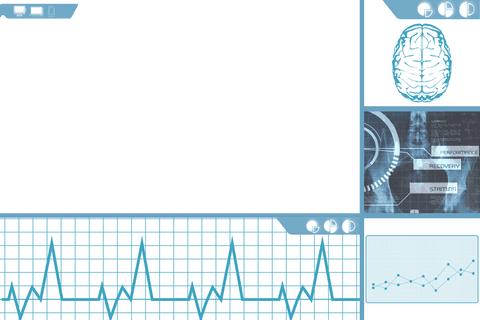
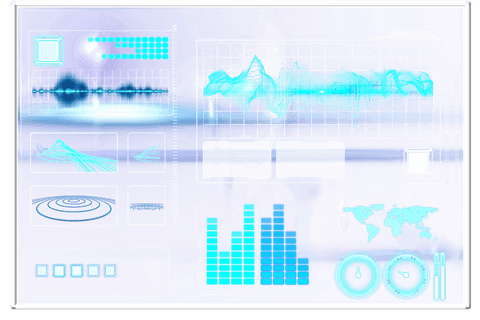
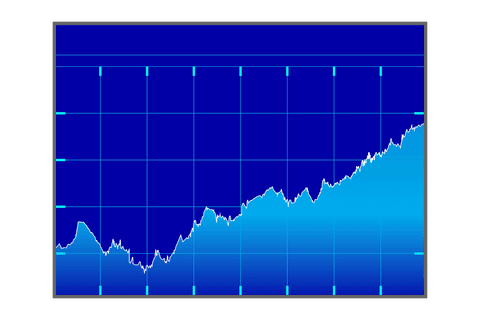
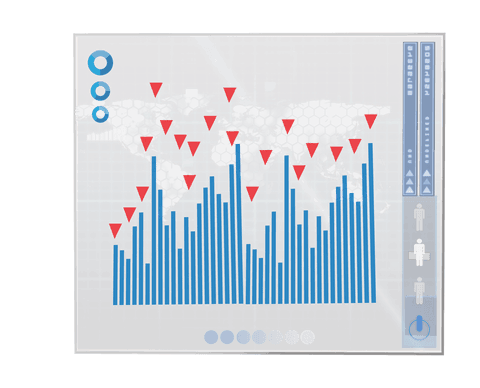
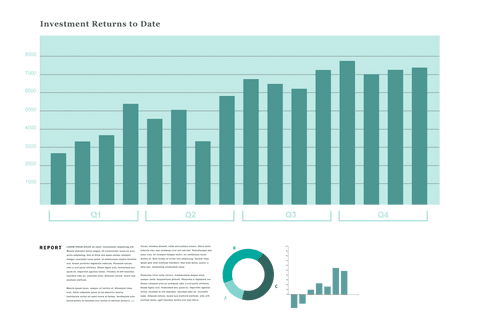
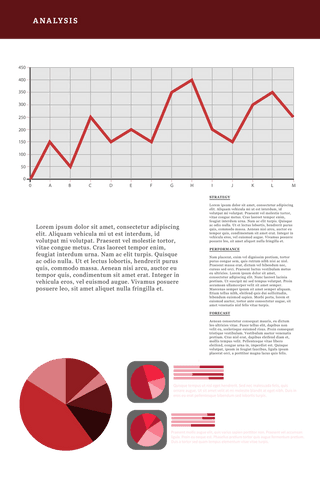
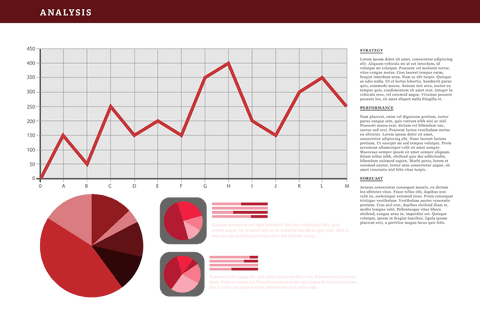
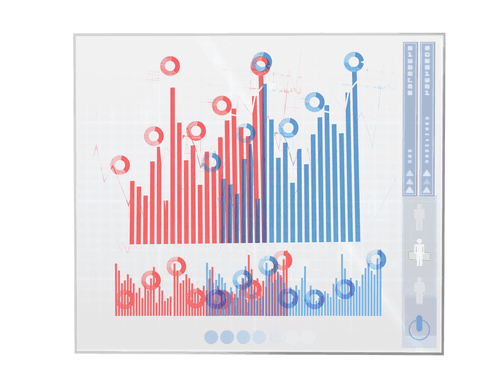
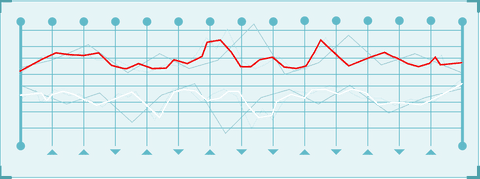
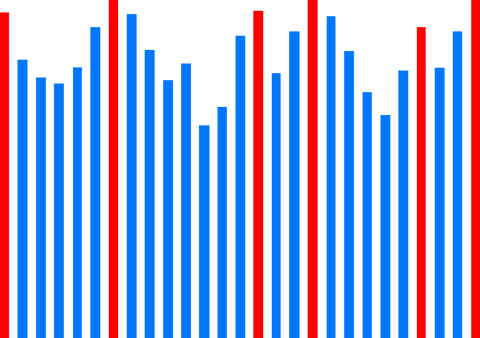
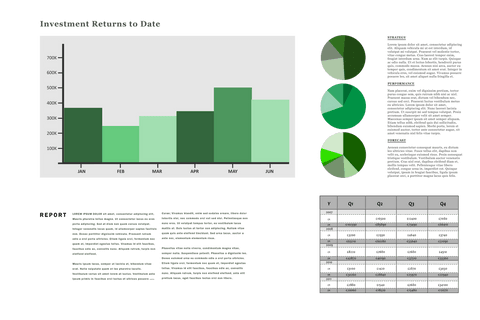
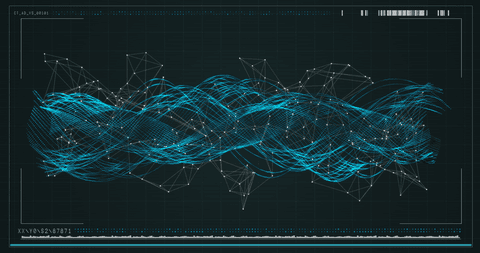
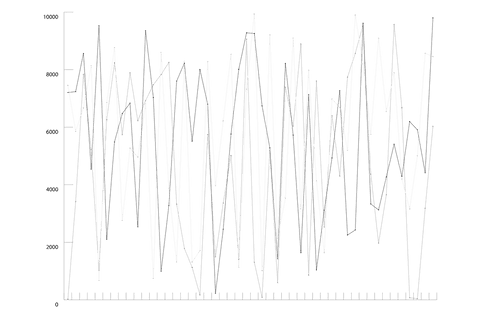
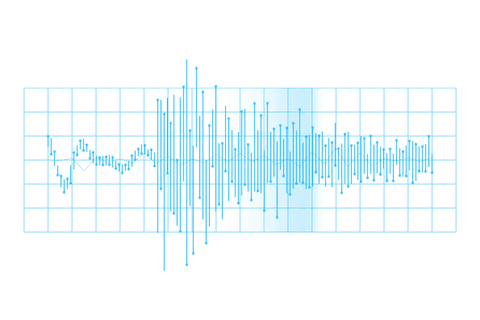
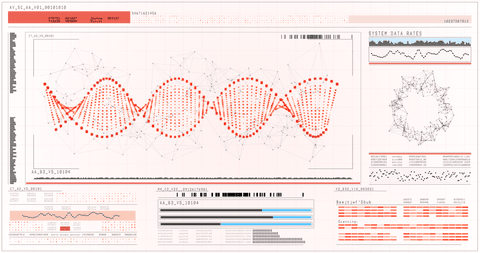
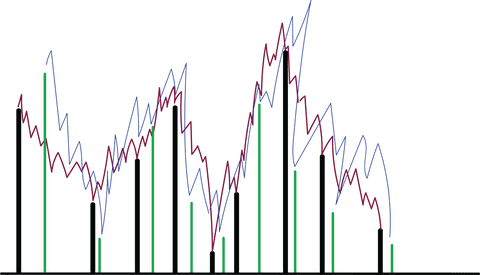
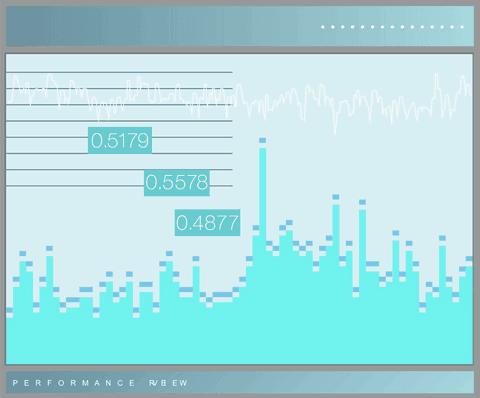
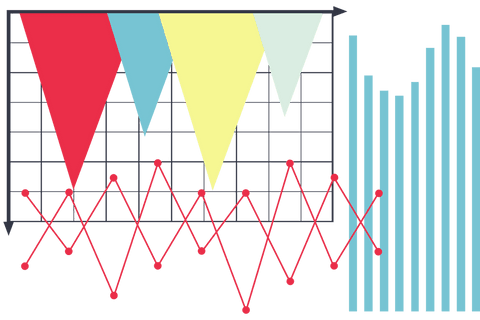
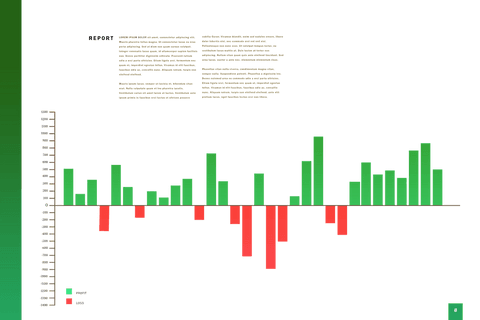
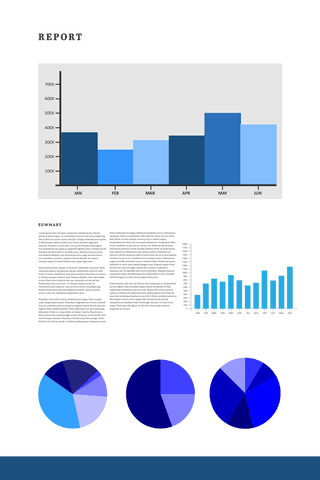
Design features a clean, modern visualization of performance levels, using bars along a Hertz axis and adding progress indicators. Useful for presentations, tech and business reports, or tech-focused learning materials with emphasis on digital interactivity and data representation reliability.

downloads
Tags:
More
Credit Photo
If you would like to credit the Photo, here are some ways you can do so
Text Link
png Link
<span class="text-link">
<span>
<a target="_blank" href=https://pikwizard.com/png/transparent-performance-levels-chart-with-bars-and-progress-bars/3f53dce6e49ada064ab9ba22c4c0b77b/>PikWizard</a>
</span>
</span>
<span class="image-link">
<span
style="margin: 0 0 20px 0; display: inline-block; vertical-align: middle; width: 100%;"
>
<a
target="_blank"
href="https://pikwizard.com/png/transparent-performance-levels-chart-with-bars-and-progress-bars/3f53dce6e49ada064ab9ba22c4c0b77b/"
style="text-decoration: none; font-size: 10px; margin: 0;"
>
<img src="https://pikwizard.com/pw/medium/3f53dce6e49ada064ab9ba22c4c0b77b.png" style="margin: 0; width: 100%;" alt="" />
<p style="font-size: 12px; margin: 0;">PikWizard</p>
</a>
</span>
</span>
Free (free of charge)
Free for personal and commercial use.
Author: Awesome Content