1. Home > 
  2. Stock PNGs > 
  3. Transparent Statistical Diagrams and Data Visualization Elements

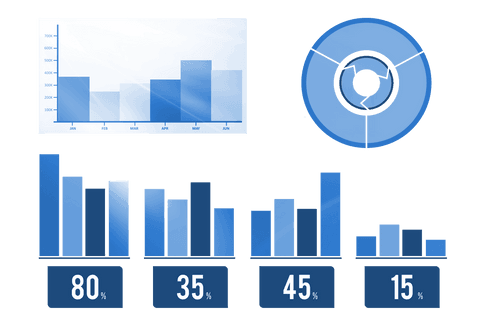
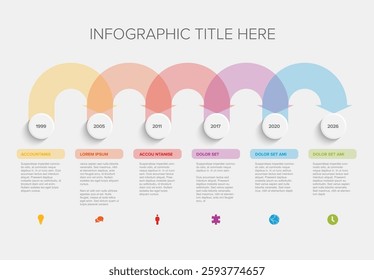
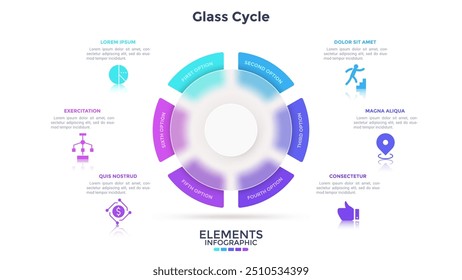
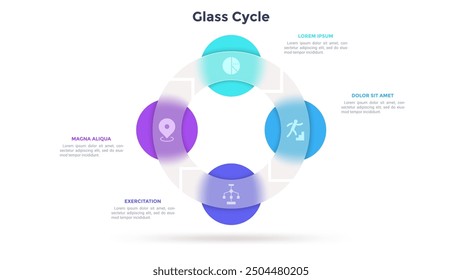
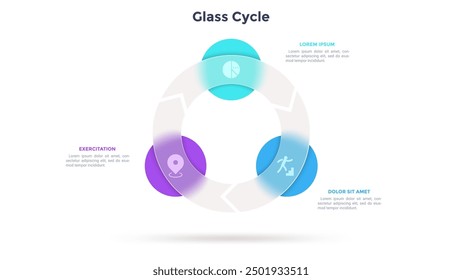
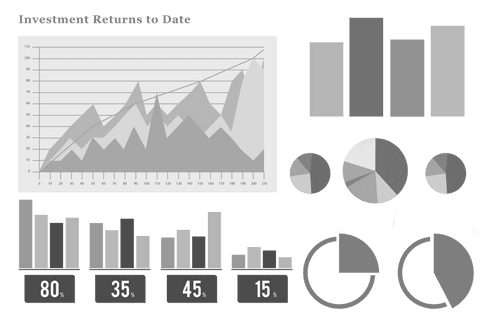
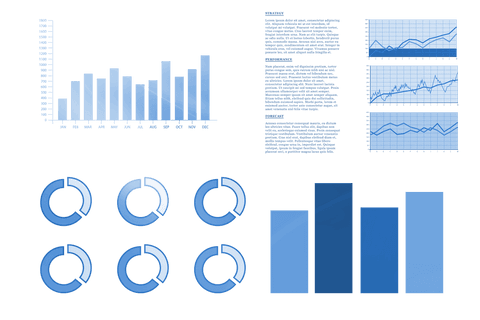
Transparent Statistical Diagrams and Data Visualization Elements PNG

Transparent Statistical Diagrams and Data Visualization Elements

Variety of transparent diagrams including graphs, charts, and data circles overlaying digital grid on white background. Great for presentations, educational material, business reports, and infographic designs requiring abstract statistical data representation.

Powered by Shutterstock logo - Get 15% off with code: PIKWIZARD15
4 points infographic with glassmorphism style with round rectangle box with layer background with 4 elements vector - Powered by Shutterstock - Get 15% off with code: PIKWIZARD15Abstract geometric network structure with connected dots and lines on a light background, symbolizing digital communication, data connections, or neural networks. - Powered by Shutterstock - Get 15% off with code: PIKWIZARD15Set of vector diagrams with superimposed translucent blue-violet circles. Examples of Venn diagrams or demonstrations of intersection of sets of 1, 2, 3, 4, and 5 spheres. - Powered by Shutterstock - Get 15% off with code: PIKWIZARD153D glossy blue pie chart icon with transparent glass effect. Business and finance infographic element. Modern data visualization symbol isolated on transparent background. Vector illustration file. - Powered by Shutterstock - Get 15% off with code: PIKWIZARD15Progress bar with 5 frames behind translucent rectangular elements placed in horizontal row. Concept of five steps to business success. Minimal infographic design template. Flat vector illustration. - Powered by Shutterstock - Get 15% off with code: PIKWIZARD15

Credit Photo

If you would like to credit the Photo, here are some ways you can do so

Free (free of charge)

Free for personal and commercial use.

Author: People Creations

Similar Free PNG Images With Transparent Background

Transparent Conceptual Doodle of Innovation and Global Growth
Premium
Infographic label design template featuring icons and four distinct steps. Ideal for process charts, presentation slides, workflow schemes, banners, flow diagrams, and data visualizations.
Digital Bar and Circle Charts on Transparent Background
Transparent Digital Interface Concept with Graphs and Icons
Transparent Vector Illustration of Data Processing with Laptop Lightbulb
Business Data Analysis on Transparent Background
Premium
Infographic label design template featuring icons and four distinct steps. Ideal for process charts, presentation slides, workflow schemes, banners, flow diagrams, and data visualizations.
Transparent Digital Scope Scanning with World Map Technology Background
Transparent Digital World Map with Data Icons
Transparent Diagram Illustrating Housing and Finance Growth
Abstract Apple Tree Digital Illustration on Transparent Background
Transparent Digital Health Monitoring Interface Concept
Colorful Diagrams on Transparent Background for Business Analysis
Transparent Infographic Elements with Graph and Chart
Premium
Infographic label design template featuring icons and five distinct steps. Ideal for process charts, presentation slides, workflow schemes, banners, flow diagrams, and data visualizations.
Transparent Business Diagrams and Charts in Grayscale
Transparent Data Visualization with Graphs and Human Icons
Growth Concept Text in Artful Transparent Design
Transparent Vector Business Diagrams on Digital Economy
Transparent Network of Teamwork Connections with Text Flow
Transparent Data Processing Illustration with Global Chart Elements
Transparent Interface with Digital Statistic Charts Illustration
Transparent Data Visuals Toolkit Background Workspace Design
Premium
A visually appealing timeline infographic with six milestones on the button time line, using colorful arcs and icons to represent different events and information in a structured layout.
Transparent Data and Infographic Elements for Business Use
Comprehensive Set of Transparent Graphs and Charts for Data Visualization
Futuristic Transparent Digital Elements for Tech Designs
Premium
Pie chart divided into 6 sectors behind round glass translucent element. Concept of six stages of transparent production cycle. Simple infographic design template. Modern flat vector illustration.
Premium
Round cyclic diagram with 4 circles behind translucent glass ring. Concept of four steps of business process. Simple infographic design template. Modern flat vector illustration for presentation.
White Digital Circuits and Charts on Transparent Background
Premium
Glowing vector 3D model of an atom with electrons rotating around the nucleus on a white background. Possible use in physics, quantum mechanics and energy-related visual content.
Digital Speech Bubble with Online Chat Text Transparent Background
Transparent World Map with Graphs Digital Infographic Vector
Digital Interface Charts on Transparent Background for Business Data Analysis
Transparent Digital Interface with Infographics and World Map
Transparent Business Data Chart with Rising Arrow Illustration
Digital Circles and World Map on Transparent Background for Tech Design
Transparent World Map and Chart Illustration for Business Concepts
Transparent Data Visualization Diagrams and Graphs Set
Digital Fitness Tracker Display with Running Man and Heartbeat on Transparent Background
Premium
Round cyclic diagram with 3 circles behind translucent glass ring. Concept of three steps of business process. Simple infographic design template. Modern flat vector illustration for presentation.
Premium
A visually appealing 3D layered infographic with six blue gradient blocks connected to text descriptions. Clean, modern design perfect for presenting hierarchical or categorized data visually.
Premium
Pie chart divided into 4 sectors behind round glass translucent element. Concept of tfour stages of transparent production cycle. Simple infographic design template. Modern flat vector illustration.
White Digital Data Statistics on Transparent Background
Blue Statistic Charts on Transparent Background for Business Analysis
Abstract Transparent Data Visuals on Transparent Background Isolated
Transparent Digital Interface with Charts and Graphs
Premium
Infographic label design template featuring icons and four distinct steps. Ideal for process charts, presentation slides, workflow schemes, banners, flow diagrams, and data visualizations.
Transparent Business Statistics Charts and Graphs for Data Analysis
Transparent Vector Illustration of Digital Interface with Charts
Premium
Translucent funnel chart or inverted pyramid diagram and four colorful layers. Concept of 4 levels of transparency. Minimal infographic design template. Modern flat vector illustration for banner.
Transparent Digital Interface with Statistic Charts for Finance
Transparent Vector Infographics Set with Maps and Diagrams
Live Chat Communication Popup Transparent Background
Colorful Transparent Charts Illustration for Business and Economy
Transparent Infographic Elements for Statistical Representation
Transparent Infographic Collection with Charts and Maps
Premium
Infographic design transparent colorful timeline template with 4 steps, options. can be used for workflow diagram, info chart, web design. vector illustration.
Global Business Data Visualization on Transparent Background
Digital Blue Data and Scope Scanning with Transparent Background
Abstract Transparent Digital Chart Elements for Presentations
Transparent Statistical Data Charts and Graphs Illustration
Transparent Medical Data Interface Vector with Heart and Diagrams
Digital Interface on Transparent Background for Innovative Design
Piggy Bank and Financial Icons on Transparent Background
Futuristic Digital Interface Illustration on Transparent Background
Premium
Infographic label design template featuring icons and four distinct steps. Ideal for process charts, presentation slides, workflow schemes, banners, flow diagrams, and data visualizations.
Transparent Infographic Set with World Map and Charts
Digital Infographic with Blue Charts on Transparent Background
Premium
GDPR principles rectangle infographic vector. General data protection regulation. Data visualization with 5 steps. Editable rectangular options chart
Premium
Rectangular comparison diagram divided into 2 parts. Concept of business model with two options to choose or select. Modern glass infographic vector illustration for data visualization, presentation.
Interactive Digital Icons on Transparent Background Vector Illustration
Futuristic Transparent Digital Interface with Data Charts
Global Network Cloud Visibility Technology Background Illustration
Global Network Concept with Abstract Elements on Transparent Background
White Number 18 with Geometric Pattern on Transparent Background
Transparent Financial Data Processing Charts and Graphs Illustration
Premium
Venn diagram with three overlapping translucent round elements. Concept of 3 areas or fields of business analysis. Minimal infographic design template. Modern flat vector illustration for banner.
Digital Transparent Interface with Medical Data Elements and Graphs
Premium
Infographic label design template featuring icons and five distinct steps. Ideal for process charts, presentation slides, workflow schemes, banners, flow diagrams, and data visualizations.
Transparent Analytics Dashboard with Editable Graphs and Elements
Creative Transparent Business Icons Illustration with Success Theme
Transparent Digital Technology Concept with Data Processing Overlay
Transparent Digital Medical Data Interface with Icons
Digital Transparent Interface with Global Data Visualization
Premium
Infographic label design template featuring icons and four distinct steps. Ideal for process charts, presentation slides, workflow schemes, banners, flow diagrams, and data visualizations.
Futuristic Digital Interface with Periodic Table on Transparent Background
Digital Interface Pattern on Transparent Background Clear Innovation
Premium
Pie chart divided into 5 sectors behind round glass translucent element. Concept of five stages of transparent production cycle. Simple infographic design template. Modern flat vector illustration.
Creative Transparent Symbols Chart Blueprint
Digital Technology Interface with Brain Icon on Transparent Background
Creative Business Sketches on Transparent Background
Transparent Digital Illustration of Data Processing Scope Scanning
Minimalistic Transparent Data Interface with Futuristic Icons
Transparent Digital Interface Elements for Business and Economics
Transparent Digital Processing Illustration on Vector Format
Comprehensive Set of Transparent Infographic Data Elements Vectors
Virtual Interface Display with Transparent Data Elements
Premium
Infographic label design template featuring icons and four distinct steps. Ideal for process charts, presentation slides, workflow schemes, banners, flow diagrams, and data visualizations.
Infographic Elements with Transparent World Map Background
Transparent Digital Data Diagrams Set for Business Technology Projects
Transparent Graphs Vector with Percentage Data and Figures
Transparent Digital Interface with Statistics Symbols
Digital Transparent Cityscape Illustration with Sun
Transparent Digital Infographics with Charts and Diagrams
Transparent Business Data Chart Infographic with Laptop
Green Graph on Transparent Background Showing Data Visualization Statistics
Transparent Periodic Table with Scope and Digital Elements
Stylish Transparent Business Graphs and Diagrams Layout
Premium
AI data analysis icon. Vector pictogram with thin black lines on transparent background. Editable stroke thickness. Perfect for analytics, reporting, and machine learning dashboards
Transparent Digital Screen with Brain, Graphs, and Earth Elements
Transparent Vector Productivity Icons with Business Elements
Premium
Architectural Diagrams icon. Simple outline monochrome black vector pictogram with thin lines on a transparent background. Line thickness is editable
Red Eighteen Birthday Candle Outline with Transparent Background
Transparent Digital Interface with World Map and Data Visualization
Transparent Leaders Leading Typography Words Graphic
Premium
Venn diagram with three intersected round elements. Concept of intersection 3 business options. Minimal flat infographic design template. Modern neumorphic vector illustration for presentation.
Cityscape Illustration on Transparent Background with Skyscrapers
Transparent Globe with Tech and Transport Icons Design
Digital Interface with Connected Circles on Transparent Background Illustration
Transparent Digital Illustration of Statistics and Analytics Icons
Transparent Mechanics Icon with Wrench and Tires
Premium
Infographic label design template featuring icons and four distinct steps. Ideal for process charts, presentation slides, workflow schemes, banners, flow diagrams, and data visualizations.
Futuristic Digital Interface Bars on Transparent Background
Back to School Transparent with Icons and School Bus Illustration
Explore More Free PNGs