- Home >
- Stock PNGs >
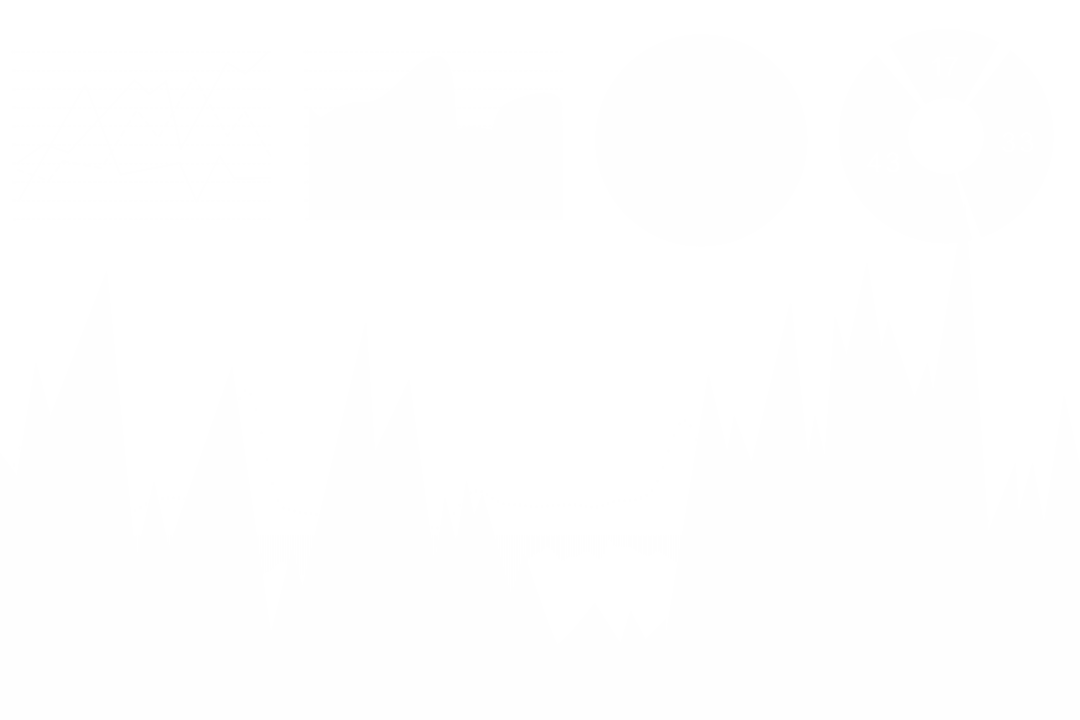
- Variety of Blue Graphs on Transparent Background
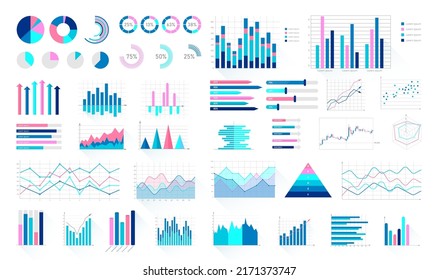
Variety of Blue Graphs on Transparent Background PNG

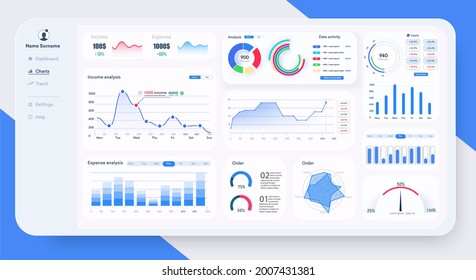
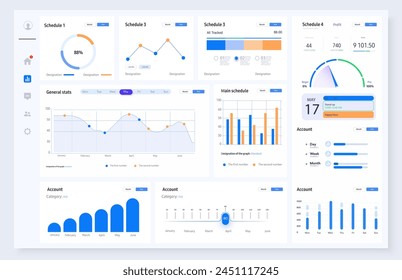
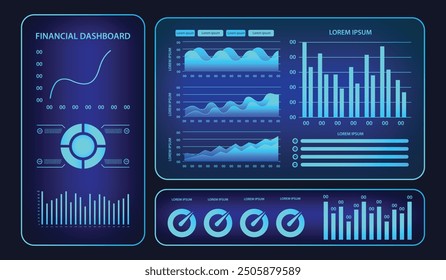
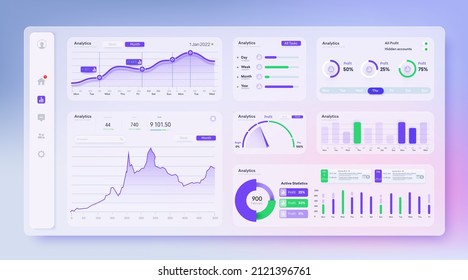
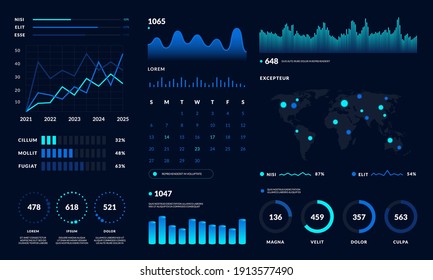
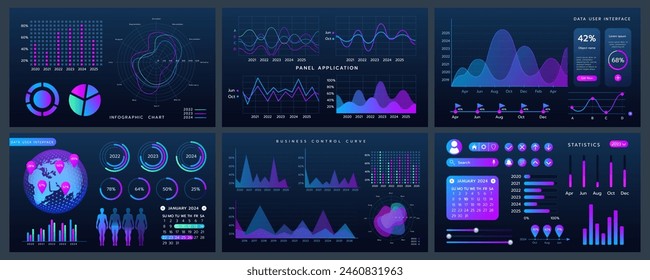
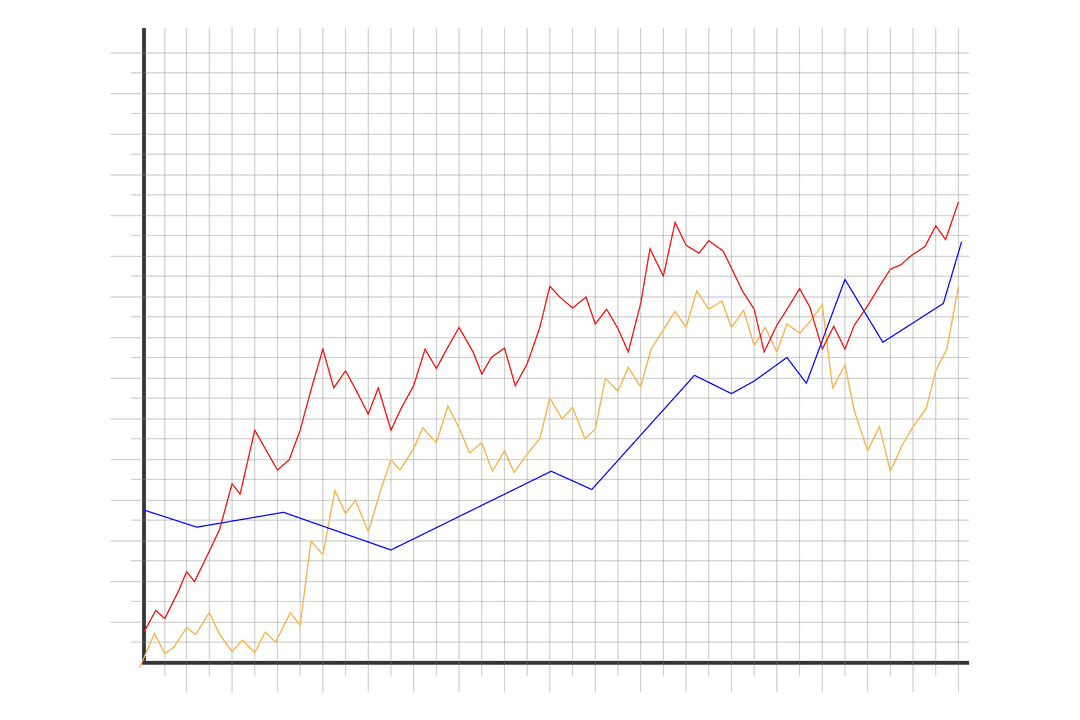
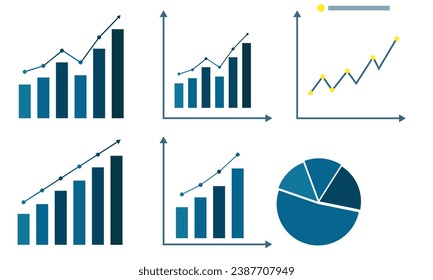
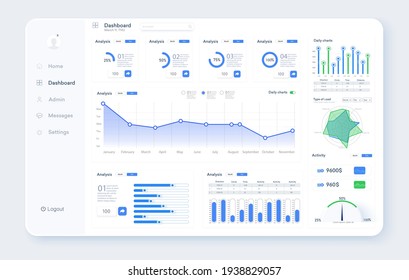
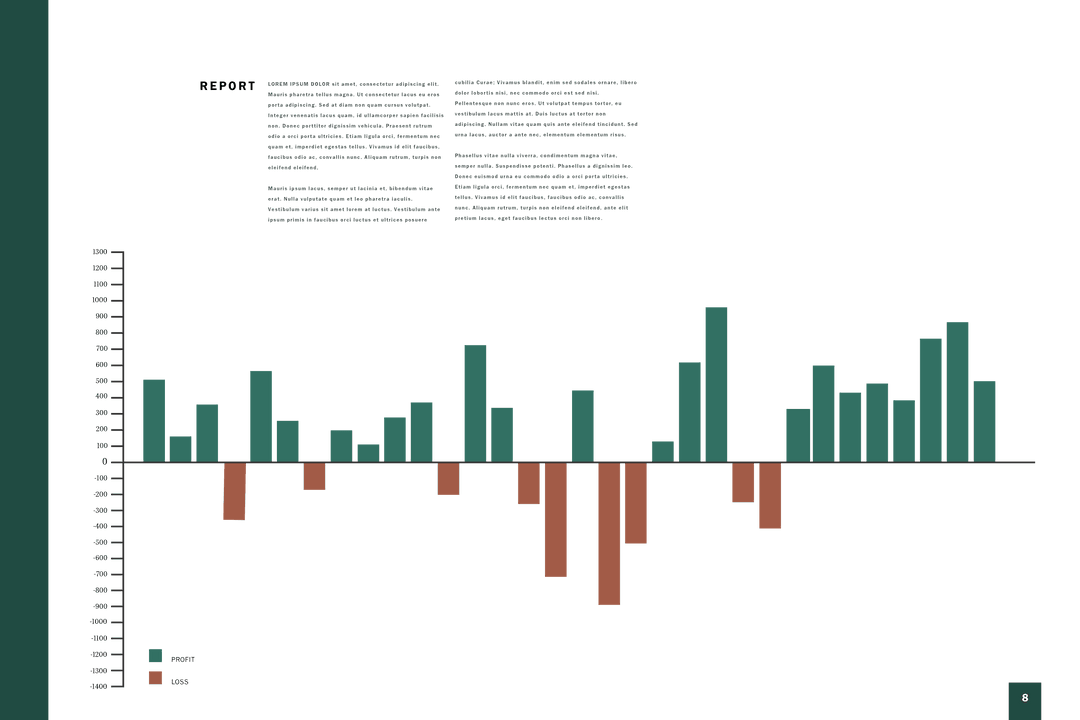
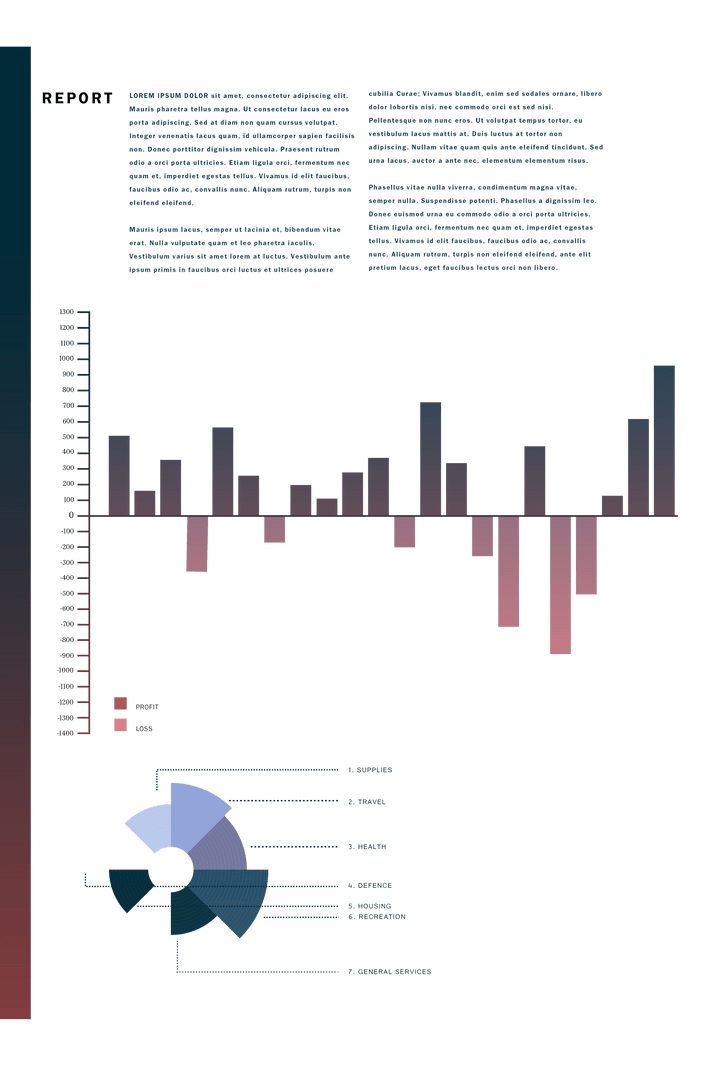
Set of nine graphic representations of data, featuring various styles like line and bar charts. Ideal for presentations, marketing materials, learning content, or anywhere that requires conveying data or information dynamically. Transparency allows easy integration into any project with backgrounds of your choice.
Powered by  - Get 15% off with code: PIKWIZARD15

0
downloads
downloads
Tags:
More
Credit Photo
If you would like to credit the Photo, here are some ways you can do so
Text Link
png Link
<span class="text-link">
<span>
<a target="_blank" href=https://pikwizard.com/png/variety-of-blue-graphs-on-transparent-background/dc677a068119bb45b6b2748b087b016b/>PikWizard</a>
</span>
</span>
<span class="image-link">
<span
style="margin: 0 0 20px 0; display: inline-block; vertical-align: middle; width: 100%;"
>
<a
target="_blank"
href="https://pikwizard.com/png/variety-of-blue-graphs-on-transparent-background/dc677a068119bb45b6b2748b087b016b/"
style="text-decoration: none; font-size: 10px; margin: 0;"
>
<img src="https://pikwizard.com/pw/medium/dc677a068119bb45b6b2748b087b016b.png" style="margin: 0; width: 100%;" alt="" />
<p style="font-size: 12px; margin: 0;">PikWizard</p>
</a>
</span>
</span>
Free (free of charge)
Free for personal and commercial use.
Author: Awesome Content
Similar Free PNG Images With Transparent Background
Premium


Premium


Premium


Premium


Premium


Premium


Premium


Premium


Premium


Premium


Premium


Premium


Premium


Premium


Premium


Premium


Premium


Premium


Premium


Premium


Premium


Premium


Premium

Premium