
- Home >
- Stock PNGs >
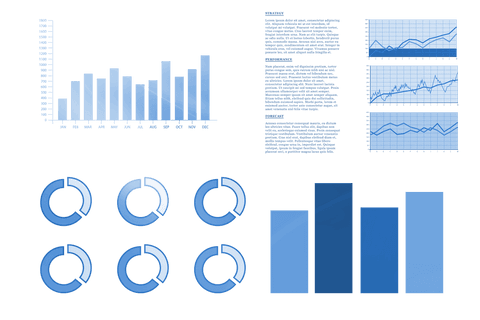
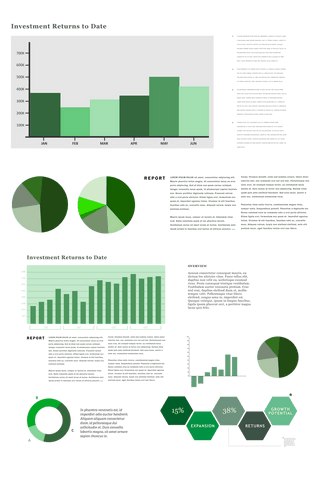
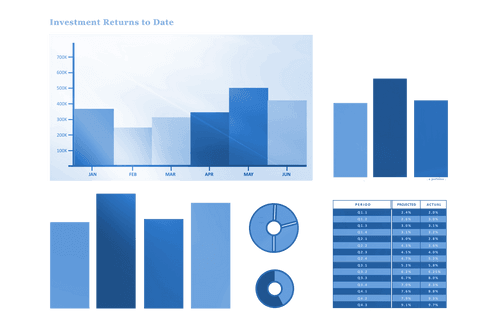
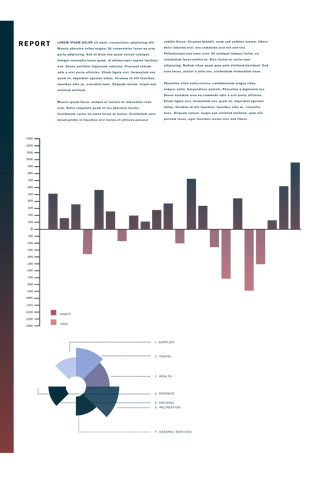
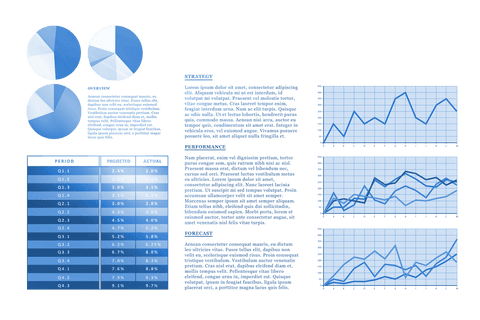
- Vector Data Charts and Graphs on Transparent Background for Presentations
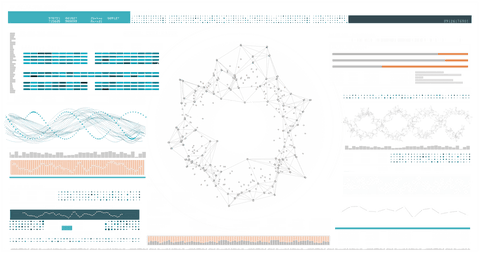
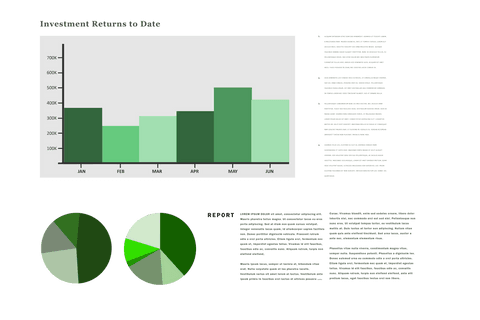
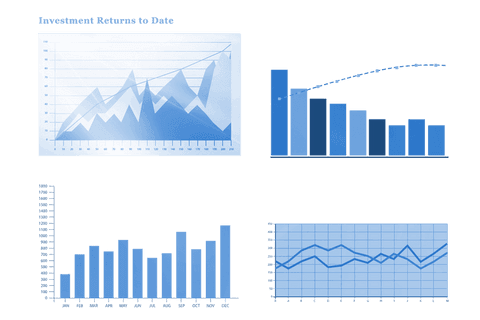
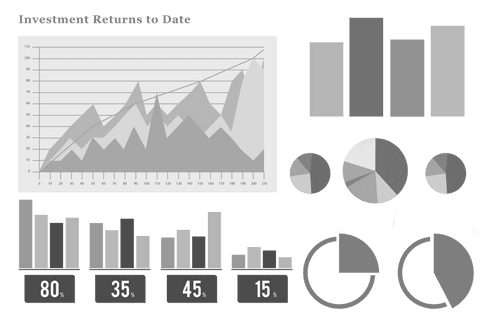
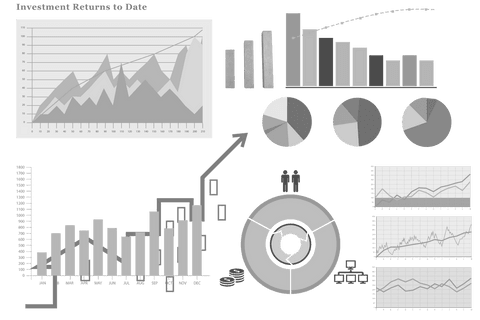
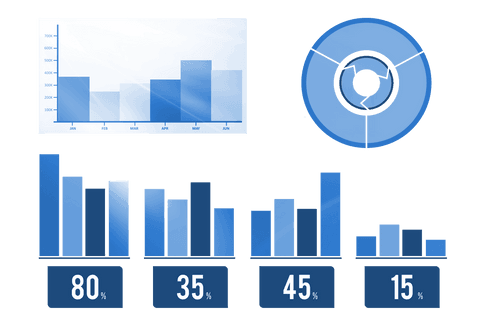
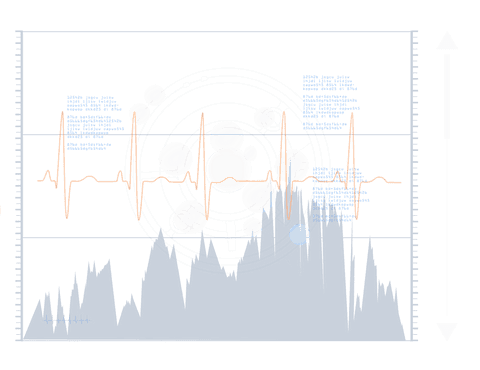
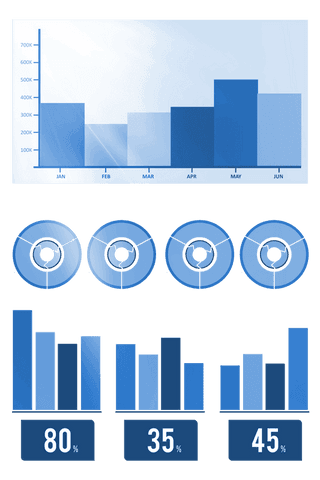
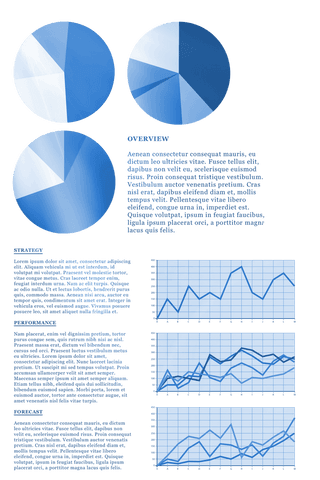
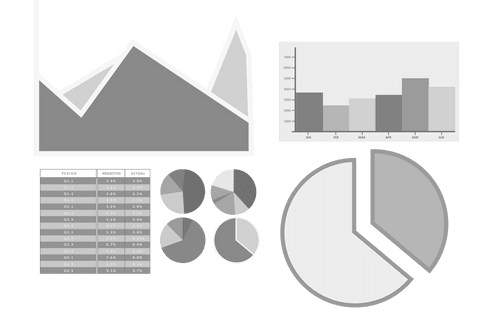
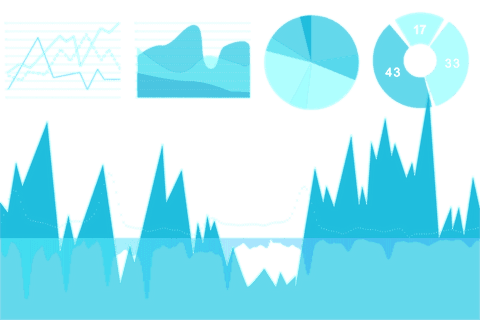
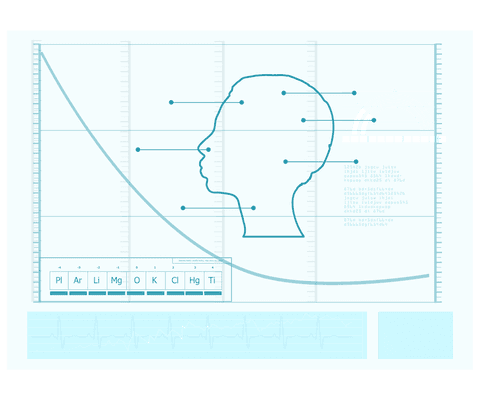
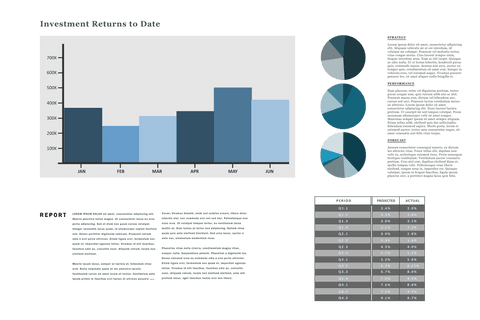
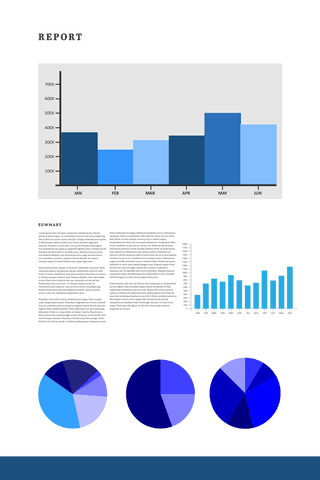
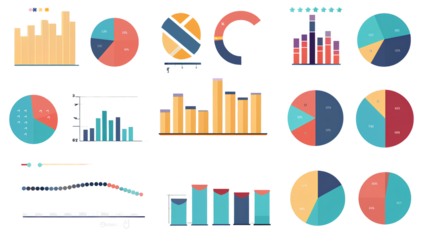
Vector Data Charts and Graphs on Transparent Background for Presentations PNG
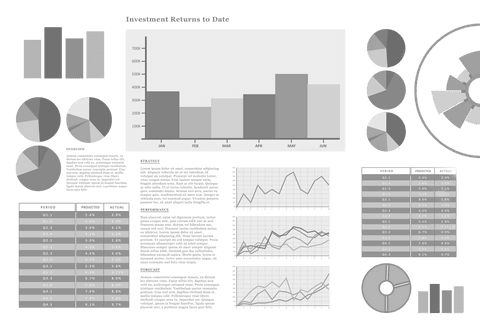
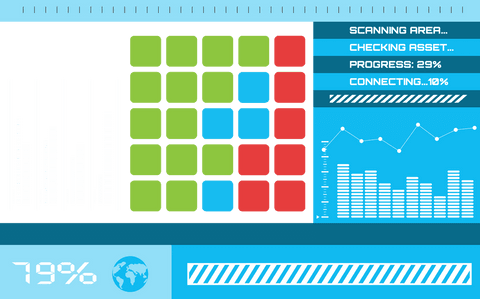
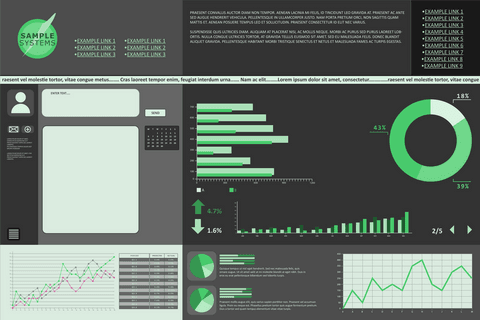
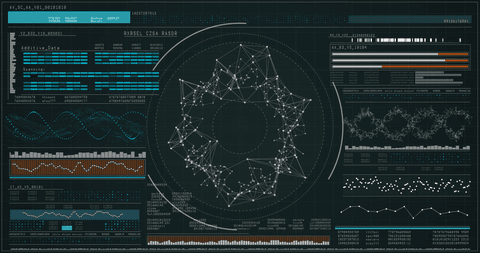
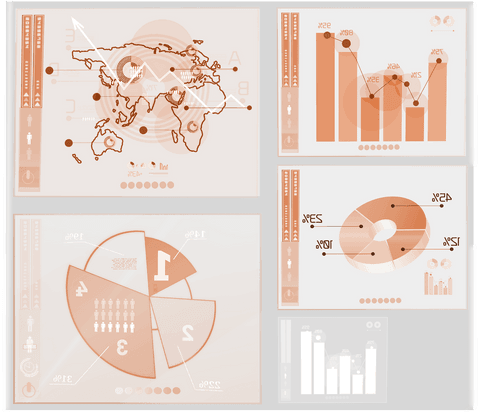
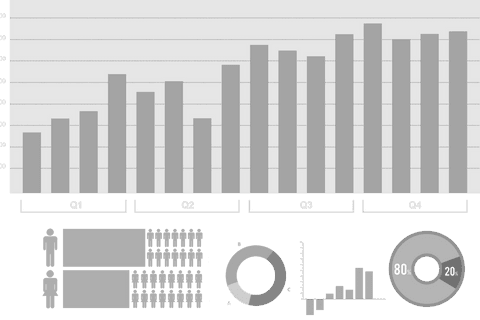
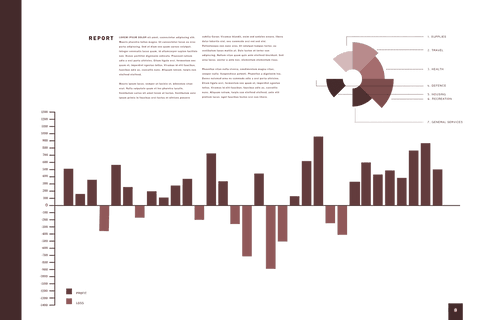
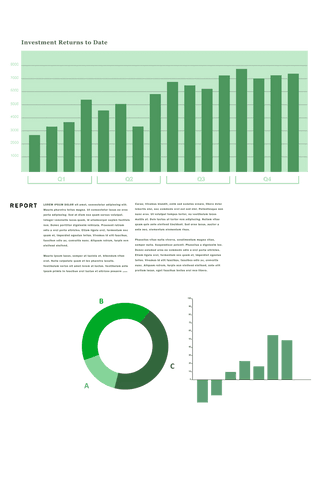
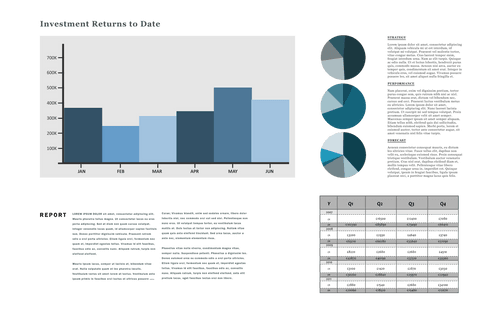
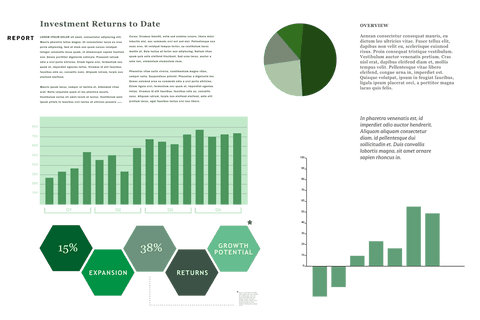
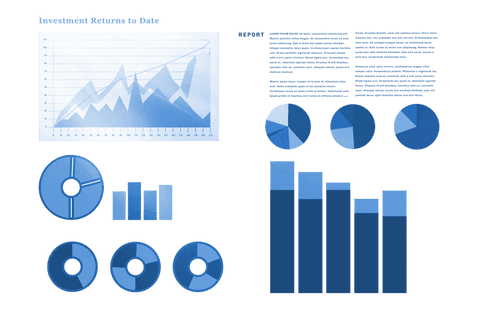
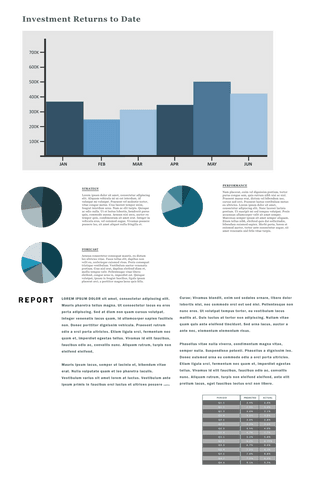
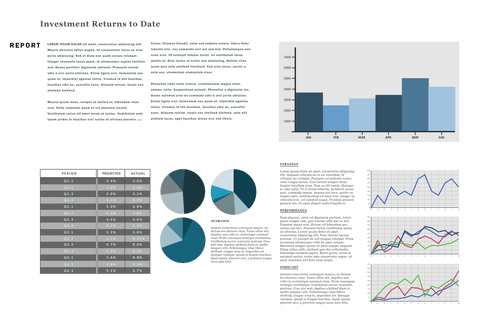
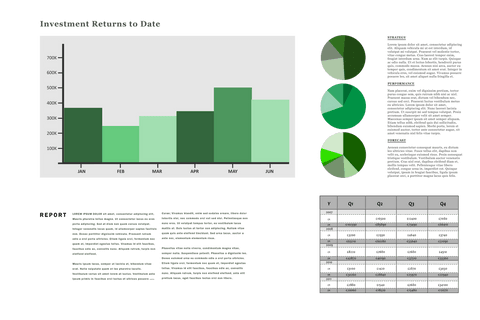
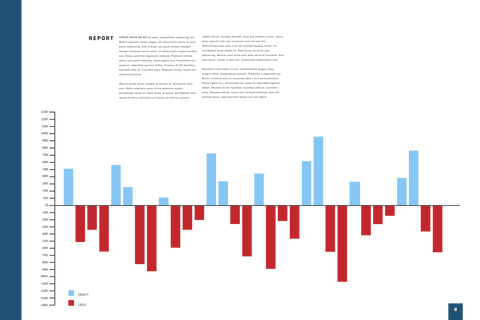
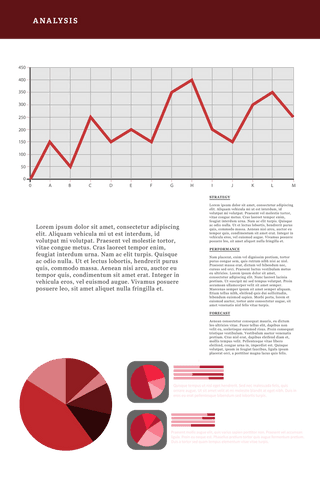
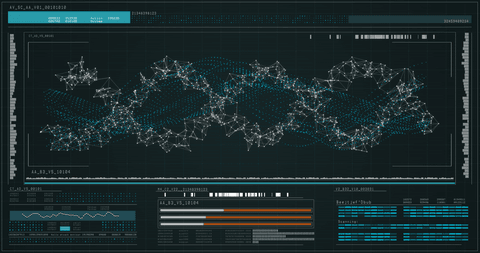
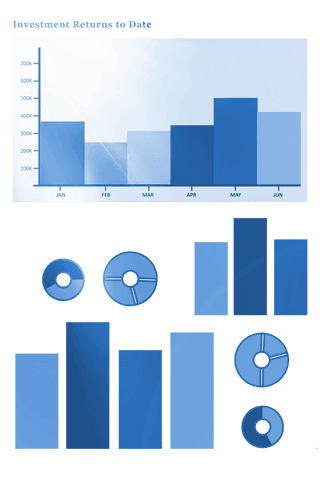
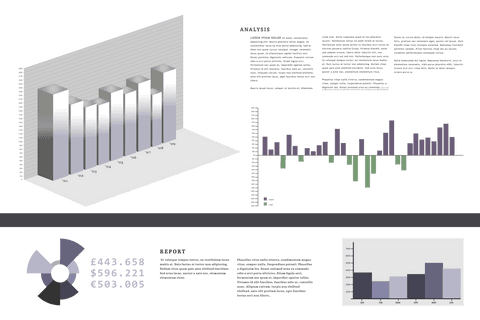
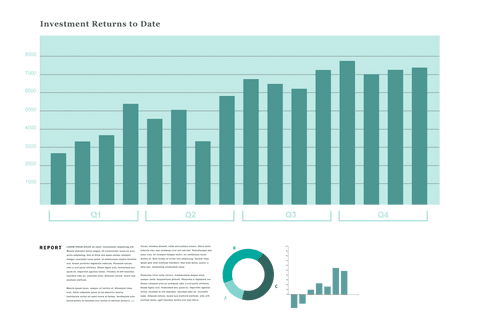
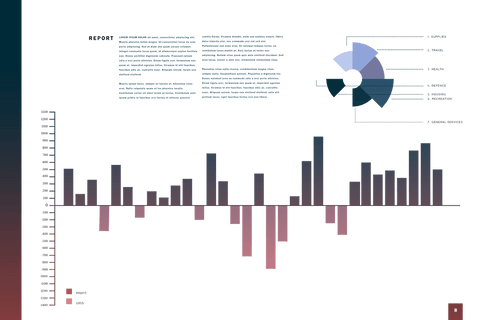
This versatile vector illustration prominently features various types of charts and graphs on a transparent background, making it ideal for creating data-centric presentations. Perfect for business reports or educational materials, the collection includes bar charts, pie charts, line graphs, and data tables, suitable for tailoring analytics to specific needs and enhancing clarity in data interpretation.
Powered by 


downloads
Tags:
More
Credit Photo
If you would like to credit the Photo, here are some ways you can do so
Text Link
png Link
<span class="text-link">
<span>
<a target="_blank" href=https://pikwizard.com/png/vector-data-charts-and-graphs-on-transparent-background-for-presentations/8897daa02b0b5c7aa3ccce3c2bd17804/>PikWizard</a>
</span>
</span>
<span class="image-link">
<span
style="margin: 0 0 20px 0; display: inline-block; vertical-align: middle; width: 100%;"
>
<a
target="_blank"
href="https://pikwizard.com/png/vector-data-charts-and-graphs-on-transparent-background-for-presentations/8897daa02b0b5c7aa3ccce3c2bd17804/"
style="text-decoration: none; font-size: 10px; margin: 0;"
>
<img src="https://pikwizard.com/pw/medium/8897daa02b0b5c7aa3ccce3c2bd17804.png" style="margin: 0; width: 100%;" alt="" />
<p style="font-size: 12px; margin: 0;">PikWizard</p>
</a>
</span>
</span>
Free (free of charge)
Free for personal and commercial use.
Author: Authentic Images
Similar Free PNG Images With Transparent Background


Premium


Premium


Premium


Premium


Premium

Premium


Premium


Premium


Premium


Premium


Premium


Premium


Premium


Premium


Premium


Premium


Premium


Premium

Premium


Premium


Premium

Premium


Premium

Premium


Premium


Explore More Free PNGs