FREE Stock Photos from PikWizardFREE Stock Photos from PikWizard
Videos
Templates
PNGs
Data SetsPhotosVideosTemplatesPNGs
More
  • Most Popular Photos

  • Most Popular Videos

  • Most Popular Templates

  • Most Popular PNGs

  • Upcoming Events

  • Blog

  • Image Editor

  • DesignWizard

  • Privacy Policy

  • Standard License

  • User Agreement

  • Contact

Popular:

  • Bowling Pins
  • Sleeping Cat
  • Winter Night Background
  • Summer Ocean
  • Recreation
  • Cactus Desktop Wallpaper
  • Spa
  • Log Cabin
  • Napa Valley
  • Purple Columbine Flower
  • Stretching
  • Barefoot
  • Static Texture
  • Cobblestone
  • Suits
  • Thinking
  • Trip
  • Zoom Backgrounds Window
  • Concrete Texture
  • Pain HD Wallpapers
  • All Photos

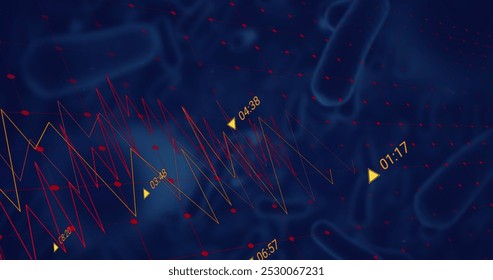
Red Zigzag Trend Lines Crossing Dark Binary Grid Representing Financial Data Fluctuations Images

  • digital
  • line
  • grid
  • visualization
  • background
  • data visualization
  • zigzag
  • analytics
  • chart
  • abstract
  • technology
  • modern
  • graphic
  • stock market
  • data
  • trend
  • dashboard
  • markers
  • translucent
  • futuristic
Loading...
 
Rising chart line over digital grid representing financial growth
green line
financial chart
data analysis
 
Glowing neon red global trend line chart showing market fluctuations on digital world map
global trend
line chart
data visualization
Premium
Candlestick financial charts over a computer keyboard, with glowing data grid, on a dark tech background, symbolizing fintech and market economy
abstract
analysis
analytics
Premium
Double exposure of city night and stack of coins for finance investor, investment and banking concept , Forex trading candlestick chart, Digital economy.
account
accounting
asian
Premium
The market volatility of crypto trading with technical graph and indicator, red and green candlesticks, for analysis up and downtrend. Cryptocurrency background concept. Focus part of candlesticks.
abstract
accounting
analysis
Premium
Financial graph on night city scape with tall buildings background multi exposure. Analysis concept.
algorithm
analysis
analytics
Premium
A rising candlestick chart. Against the backdrop of the night city
analysis
banking
business
Premium
Close-up of a crypto trader or investor eye with candlestick charts and financial graphs reflecting in his eyeglasses. Cryptocurrency or stock market concept
analysis
analyst
analyze
 
Red zigzag trend lines crossing dark binary grid representing financial data fluctuations
financial chart
stock market
data visualization
Premium
Abstract close-up of multicolored financial charts on a digital screen, displaying real-time market trends with bars and lines.
analysis
analytics
bars
 
Futuristic neon light stripes creating digital interface
neon lines
futuristic background
retro future
 
Red arrow with binary background showing market decline
downtrend
data analysis
binary code
Premium
Abstract digital graph with glowing numbers on a reflective black surface, futuristic concept, technology and finance background
analysis
analytics
backdrop
Premium
Image of binary coding. Global technology digital interface and connections concept digitally generated image.
app development
artificial intelligence
big data
Premium
graph coins stock finance and business concept
abstract
account
accounting
Premium
stock market interface on lcd display with blur and moire effects, digital trading concept
anonymous
background
banking
Premium
Candle stick graph chart with indicator: Cryptocurrencies graphs trading including of up and down trend with divergent reverse price pattern.
altcoin
background
banking
 
Neon cyan contour lines flowing on dark canvas with luminous bokeh orbs
neon cyan
contour lines
topography
 
Blockchain data analysis with digital dashboard interactive interface
analytics
data visualization
digital dashboard
Premium
Displaying red and blue graphs showing percentage changes on dark grid, with code-text overlays. Charts, analytics, data visualization, finance, technology, digital, futuristic
abstract
analytics
background
Premium
Falling forex stock market hologram, bar chart dynamics with red arrows and candlesticks. Double exposure city skyscrapers at night. Concept of online trading, crash and financial risk
analysis
analytics
arrow
Premium
Displaying trading platform interface showing candlestick bars and line graph, with grid and labels. Finance, investment, analytics, data visualization, technology, digital, business
analysis
analytics
annotations
 
Zigzag financial trend line with candlesticks and cyan markers on minimal gray background
financial chart
candlestick chart
trend line
Premium
Stock market changes, business bar chart. Double exposure with New York skyscrapers and mirrored skyline, growing candlesticks and lines. Concept of forex and investment
analysis
analytics
bar
Explore More Free Stock Images