- Home >
- Stock Templates >
- Bold Financial Report Charts and Graphics for Presentations
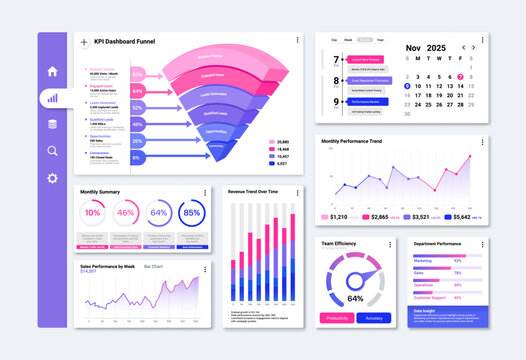
Bold Financial Report Charts and Graphics for Presentations Template

Features dynamic visual infographic design with vibrant colors and various graph formats. Ideal for corporate financial presentation, this layout can be adapted for educational finance materials or workshops on data analysis. Captivates audiences with its engaging, analytical representation.
Powered by 


4
downloads
downloads
Tags:
More
Credit Photo
If you would like to credit the Photo, here are some ways you can do so
Text Link
template Link
<span class="text-link">
<span>
<a target="_blank" href=https://pikwizard.com/template/bold-financial-report-charts-and-graphics-for-presentations/73b5ada9d4bd423429a6e950747e8614/>PikWizard</a>
</span>
</span>
<span class="image-link">
<span
style="margin: 0 0 20px 0; display: inline-block; vertical-align: middle; width: 100%;"
>
<a
target="_blank"
href="https://pikwizard.com/template/bold-financial-report-charts-and-graphics-for-presentations/73b5ada9d4bd423429a6e950747e8614/"
style="text-decoration: none; font-size: 10px; margin: 0;"
>
<img src="https://pikwizard.com/pw/medium/73b5ada9d4bd423429a6e950747e8614.jpg" style="margin: 0; width: 100%;" alt="" />
<p style="font-size: 12px; margin: 0;">PikWizard</p>
</a>
</span>
</span>
Free (free of charge)
Free for personal and commercial use.
Author: Creative Art
Similar Free Templates

Premium


Premium


Premium


Premium


Premium


Premium


Premium


Premium


Premium


Premium


Premium


Premium


Premium


Premium


Premium


Premium


Premium


Premium


Premium


Premium


Premium


Premium


Premium


Premium