
- Home >
- Stock Templates >
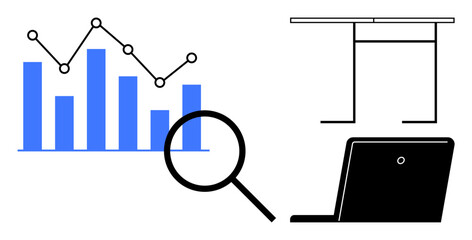
- Business Analytics and Strategy with Statistical Graphs
Business Analytics and Strategy with Statistical Graphs Template

Image depicts laptop displaying statistical graphs, symbolizing business analytics and strategy focus. Ideal for use in presentations on market research, business strategy planning, or as a visual backdrop in financial and analytics webinars. Great for articles about content delivery solutions and professional development in the field of business analytics.
Powered by 


downloads
Tags:
More
Credit Photo
If you would like to credit the Photo, here are some ways you can do so
Text Link
template Link
<span class="text-link">
<span>
<a target="_blank" href=https://pikwizard.com/template/business-analytics-and-strategy-with-statistical-graphs/ad01ad1f6e3ac0f800d9dd95c6a0e9de/>PikWizard</a>
</span>
</span>
<span class="image-link">
<span
style="margin: 0 0 20px 0; display: inline-block; vertical-align: middle; width: 100%;"
>
<a
target="_blank"
href="https://pikwizard.com/template/business-analytics-and-strategy-with-statistical-graphs/ad01ad1f6e3ac0f800d9dd95c6a0e9de/"
style="text-decoration: none; font-size: 10px; margin: 0;"
>
<img src="https://pikwizard.com/pw/medium/ad01ad1f6e3ac0f800d9dd95c6a0e9de.jpg" style="margin: 0; width: 100%;" alt="" />
<p style="font-size: 12px; margin: 0;">PikWizard</p>
</a>
</span>
</span>
Free (free of charge)
Free for personal and commercial use.
Author: People Creations
Similar Free Templates


Premium

Premium


Premium


Premium


Premium


Premium

Premium


Premium


Premium

Premium

Premium


Premium


Premium


Premium


Premium


Premium

Premium


Premium


Premium


Premium


Premium


Premium


Premium


Premium


Premium


Explore More Free Templates