
- Home >
- Stock Templates >
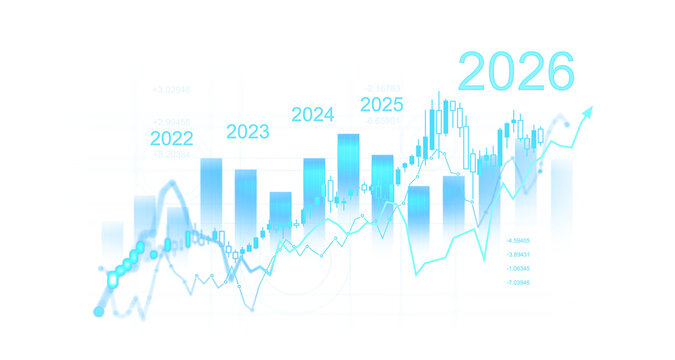
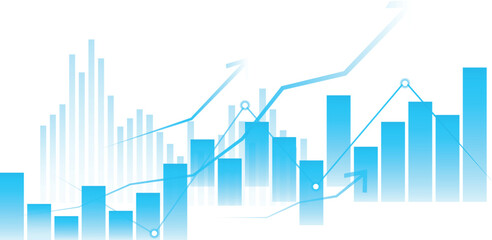
- Modern Financial Data Visualization with Graphs and Charts
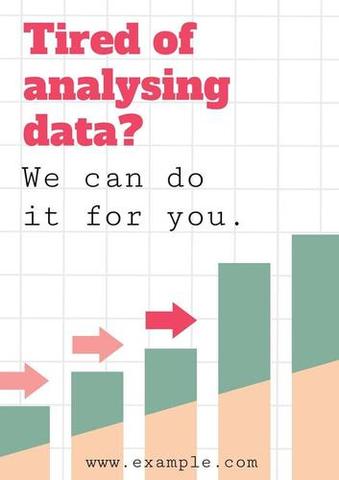
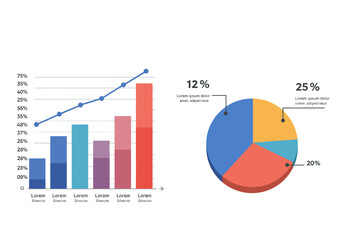
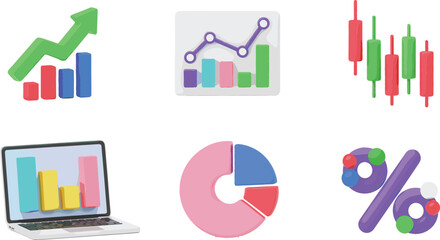
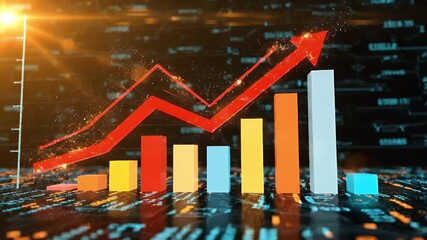
Modern Financial Data Visualization with Graphs and Charts Template
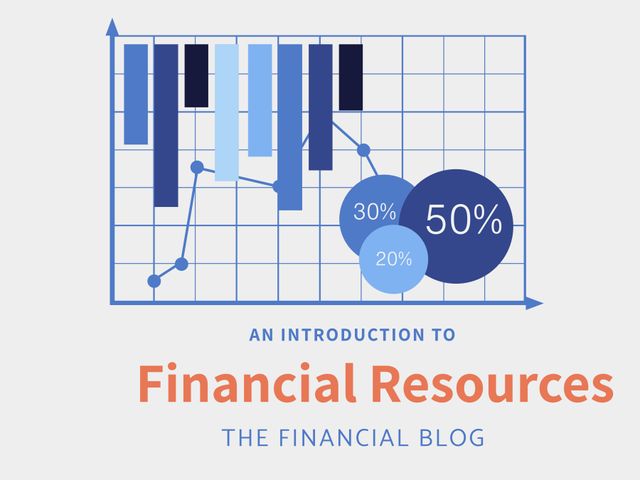
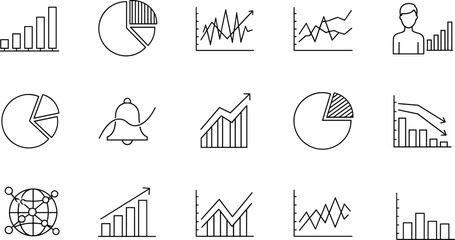
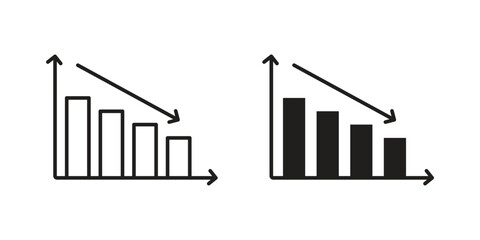
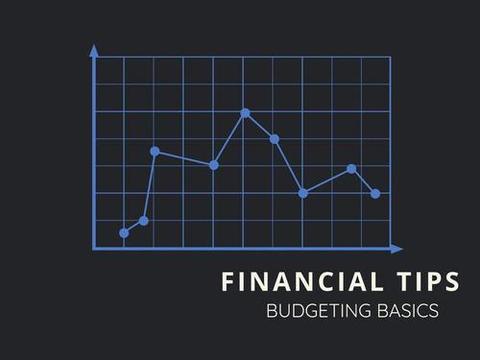
Visual representation of financial data using bar graphs and pie charts illustrating economic trends and growth. Useful for creating impactful presentations, enhancing business proposals, or supporting educational content in economics and finance.
Powered by 


downloads
Tags:
More
Credit Photo
If you would like to credit the Photo, here are some ways you can do so
Text Link
template Link
<span class="text-link">
<span>
<a target="_blank" href=https://pikwizard.com/template/modern-financial-data-visualization-with-graphs-and-charts/a98b11fb399ef8d219e1016b715aacf7/>PikWizard</a>
</span>
</span>
<span class="image-link">
<span
style="margin: 0 0 20px 0; display: inline-block; vertical-align: middle; width: 100%;"
>
<a
target="_blank"
href="https://pikwizard.com/template/modern-financial-data-visualization-with-graphs-and-charts/a98b11fb399ef8d219e1016b715aacf7/"
style="text-decoration: none; font-size: 10px; margin: 0;"
>
<img src="https://pikwizard.com/pw/medium/a98b11fb399ef8d219e1016b715aacf7.jpg" style="margin: 0; width: 100%;" alt="" />
<p style="font-size: 12px; margin: 0;">PikWizard</p>
</a>
</span>
</span>
Free (free of charge)
Free for personal and commercial use.
Author: Awesome Content
Similar Free Templates


Premium


Premium


Premium


Premium

Premium


Premium


Premium


Premium


Premium


Premium


Premium


Premium


Premium

Premium


Premium


Premium


Premium


Premium


Premium


Premium


Premium


Premium


Premium


Premium


Premium


Explore More Free Templates