
- Home >
- Stock Videos >
- 3D Animated Business Graph Illustrating Data Trends by Month
3D Animated Business Graph Illustrating Data Trends by Month Video
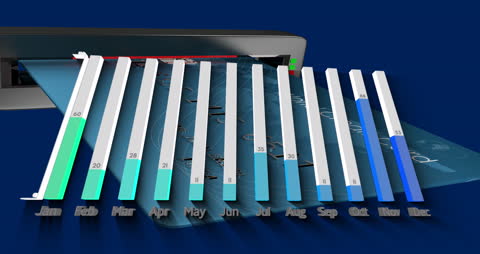
Engaging visual for presentations or reports highlighting business trends. Ideal for illustrating monthly fluctuations and technological integration in data analysis.
Powered by  - Get 15% off with code: PIKWIZARD15


3
downloads
downloads
Tags:
More
Credit Photo
If you would like to credit the Photo, here are some ways you can do so
Text Link
video Link
<span class="text-link">
<span>
<a target="_blank" href=https://pikwizard.com/video/3d-animated-business-graph-illustrating-data-trends-by-month/e5af83107c06f57297eb65a0f8d2a85b/>PikWizard</a>
</span>
</span>
<span class="image-link">
<span
style="margin: 0 0 20px 0; display: inline-block; vertical-align: middle; width: 100%;"
>
<a
target="_blank"
href="https://pikwizard.com/video/3d-animated-business-graph-illustrating-data-trends-by-month/e5af83107c06f57297eb65a0f8d2a85b/"
style="text-decoration: none; font-size: 10px; margin: 0;"
>
<video controls style="width: 100%; margin: 0;">
<source src="https://player.vimeo.com/progressive_redirect/playback/912397476/rendition/240p/file.mp4?loc=external&oauth2_token_id=1223210874&signature=d56f8af01c6960c198c0aaa54a13fca8816bd3f6441ff2382229e7f6794870a4" type="video/mp4"
poster="https://pikwizard.com/pw/medium/e5af83107c06f57297eb65a0f8d2a85b.jpg"/>
Your browser does not support the video tag.
</video>
<p style="font-size: 12px; margin: 0;">PikWizard</p>
</a>
</span>
</span>
Free (free of charge)
Free for personal and commercial use.
Author: Awesome Content