
- Home >
- Stock Videos >
- 3D Animated Financial Graph with Data Dynamics on Blue Grid
3D Animated Financial Graph with Data Dynamics on Blue Grid Video
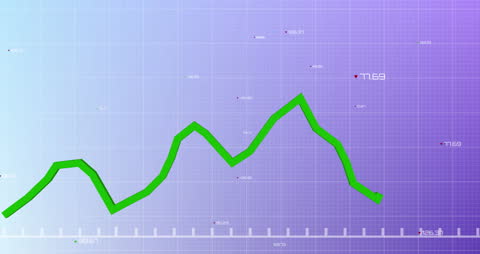
Illustration featuring an animated financial graph against a blue background with changing data values in a grid-like pattern. Its dynamic visualization is ideal for presenting concepts in economics, investment reports, strategic decision-making, and business profit analysis.
Powered by  - Get 15% off with code: PIKWIZARD15


downloads
Tags:
More
Credit Photo
If you would like to credit the Photo, here are some ways you can do so
Text Link
video Link
<span class="text-link">
<span>
<a target="_blank" href=https://pikwizard.com/video/3d-animated-financial-graph-with-data-dynamics-on-blue-grid/38891e7802e9967543ab06a050a3d644/>PikWizard</a>
</span>
</span>
<span class="image-link">
<span
style="margin: 0 0 20px 0; display: inline-block; vertical-align: middle; width: 100%;"
>
<a
target="_blank"
href="https://pikwizard.com/video/3d-animated-financial-graph-with-data-dynamics-on-blue-grid/38891e7802e9967543ab06a050a3d644/"
style="text-decoration: none; font-size: 10px; margin: 0;"
>
<video controls style="width: 100%; margin: 0;">
<source src="https://player.vimeo.com/progressive_redirect/playback/830455210/rendition/240p/file.mp4?loc=external&oauth2_token_id=1223210874&signature=06b0352af0bde794ce8daf12c52471de8dfead4c35bfd279a889483cfa6959b3" type="video/mp4"
poster="https://pikwizard.com/pw/medium/38891e7802e9967543ab06a050a3d644.jpg"/>
Your browser does not support the video tag.
</video>
<p style="font-size: 12px; margin: 0;">PikWizard</p>
</a>
</span>
</span>
Free (free of charge)
Free for personal and commercial use.
Author: Awesome Content