
- Home >
- Stock Videos >
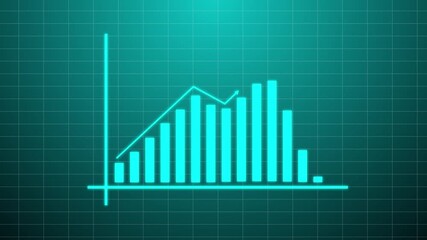
- 3D Animation of Financial Data on Grid Background
3D Animation of Financial Data on Grid Background Video
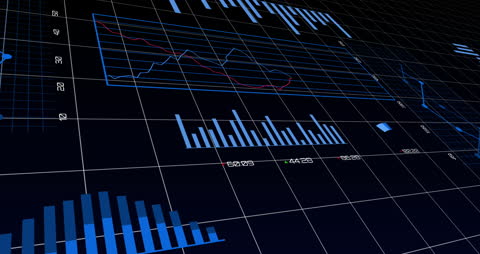
Digital animation showing complex financial data on grid can be used in presentations for explaining stock market analysis, business models, and financial courses. Useful for illustrating data processing or for use in websites and articles focusing on technology and finance in the global market.
Powered by 


1
downloads
downloads
Tags:
More
Credit Photo
If you would like to credit the Photo, here are some ways you can do so
Text Link
video Link
<span class="text-link">
<span>
<a target="_blank" href=https://pikwizard.com/video/3d-animation-of-financial-data-on-grid-background/4b2b31ddcbf95e09165232b5f11dfde3/>PikWizard</a>
</span>
</span>
<span class="image-link">
<span
style="margin: 0 0 20px 0; display: inline-block; vertical-align: middle; width: 100%;"
>
<a
target="_blank"
href="https://pikwizard.com/video/3d-animation-of-financial-data-on-grid-background/4b2b31ddcbf95e09165232b5f11dfde3/"
style="text-decoration: none; font-size: 10px; margin: 0;"
>
<video controls style="width: 100%; margin: 0;">
<source src="https://player.vimeo.com/progressive_redirect/playback/718388894/rendition/240p/file.mp4?loc=external&oauth2_token_id=1223210874&signature=2f84afcec29bac300d68fe547e831e173b813e9992a651e704667ec7b86bceee" type="video/mp4"
poster="https://pikwizard.com/pw/medium/4b2b31ddcbf95e09165232b5f11dfde3.jpg"/>
Your browser does not support the video tag.
</video>
<p style="font-size: 12px; margin: 0;">PikWizard</p>
</a>
</span>
</span>
Free (free of charge)
Free for personal and commercial use.
Author: Awesome Content