
- Home >
- Stock Videos >
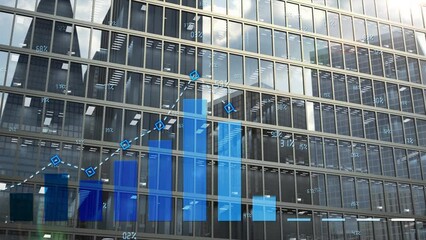
- 3D Bar Graph Displayed Against Glass Skyscraper for Market Analysis
3D Bar Graph Displayed Against Glass Skyscraper for Market Analysis Video
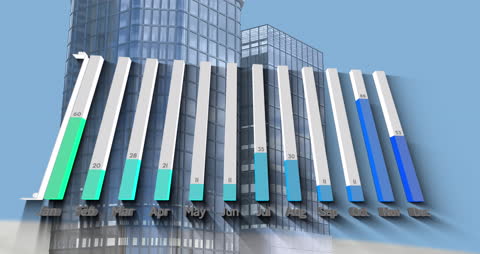
This visual displays a 3D bar graph showcasing monthly data fluctuations in front of a modern glass skyscraper. Ideal for presentations on market trends, financial growth analysis, and business forecasting. It can enhance reports on corporate performance, economic research, and educational resources involving data insights.
Powered by 


1
downloads
downloads
Tags:
More
Credit Photo
If you would like to credit the Photo, here are some ways you can do so
Text Link
video Link
<span class="text-link">
<span>
<a target="_blank" href=https://pikwizard.com/video/3d-bar-graph-displayed-against-glass-skyscraper-for-market-analysis/1177364b4e5d4f2ef1a6300fef7b8469/>PikWizard</a>
</span>
</span>
<span class="image-link">
<span
style="margin: 0 0 20px 0; display: inline-block; vertical-align: middle; width: 100%;"
>
<a
target="_blank"
href="https://pikwizard.com/video/3d-bar-graph-displayed-against-glass-skyscraper-for-market-analysis/1177364b4e5d4f2ef1a6300fef7b8469/"
style="text-decoration: none; font-size: 10px; margin: 0;"
>
<video controls style="width: 100%; margin: 0;">
<source src="https://player.vimeo.com/progressive_redirect/playback/722047978/rendition/240p/file.mp4?loc=external&oauth2_token_id=1223210874&signature=01cf5634234bd559239c345445e20eda7b1c28779cb953e922d77bbf04365343" type="video/mp4"
poster="https://pikwizard.com/pw/medium/1177364b4e5d4f2ef1a6300fef7b8469.jpg"/>
Your browser does not support the video tag.
</video>
<p style="font-size: 12px; margin: 0;">PikWizard</p>
</a>
</span>
</span>
Free (free of charge)
Free for personal and commercial use.
Author: Awesome Content