- Home >
- Stock Videos >
- 3D Bar Graph Overlay on Wind Turbine Landscape
3D Bar Graph Overlay on Wind Turbine Landscape Video

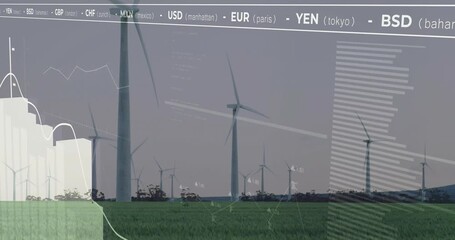
The video features a 3D bar graph with financial or analytical data overlayed on a scenic landscape of wind turbines under a clear blue sky. Each bar is labeled with months and corresponding numerical values, providing a visual analysis of data trends across different months. This visual can be utilized in presentations about renewable energy, financial analytics, environmental studies, or reports on sustainability initiatives to emphasize the convergence of technology and ecology.
0
downloads
downloads
Tags:
More
Credit Photo
If you would like to credit the Photo, here are some ways you can do so
Text Link
video Link
<span class="text-link">
<span>
<a target="_blank" href=https://pikwizard.com/video/3d-bar-graph-overlay-on-wind-turbine-landscape/a646df3ff04c92290a462366d93a5400/>PikWizard</a>
</span>
</span>
<span class="image-link">
<span
style="margin: 0 0 20px 0; display: inline-block; vertical-align: middle; width: 100%;"
>
<a
target="_blank"
href="https://pikwizard.com/video/3d-bar-graph-overlay-on-wind-turbine-landscape/a646df3ff04c92290a462366d93a5400/"
style="text-decoration: none; font-size: 10px; margin: 0;"
>
<video controls style="width: 100%; margin: 0;">
<source src="https://player.vimeo.com/progressive_redirect/playback/719174612/rendition/240p/file.mp4?loc=external&oauth2_token_id=1223210874&signature=235f20ca938eb96aca6e88758e8c965f179ac3b0fdd59679de29c893eaef3cfc" type="video/mp4"
poster="https://pikwizard.com/pw/medium/a646df3ff04c92290a462366d93a5400.jpg"/>
Your browser does not support the video tag.
</video>
<p style="font-size: 12px; margin: 0;">PikWizard</p>
</a>
</span>
</span>
Free (free of charge)
Free for personal and commercial use.
Author: Awesome Content


