
- Home >
- Stock Videos >
- 3D Monthly Data Visualization with Rising Bars
3D Monthly Data Visualization with Rising Bars Video
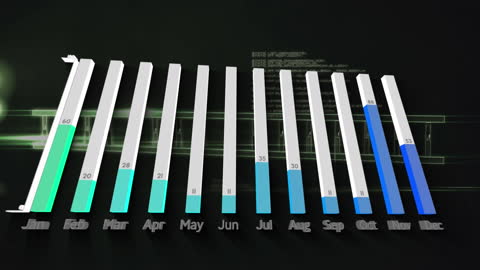
A 3D bar graph displaying monthly data in a digital, futuristic style uses a dark background to highlight rising bars, each month showcasing various heights. Ideal for business presentations, technology reports, data analysis illustrations or educational materials related to data trends and analytics.

downloads
Tags:
More
Credit Photo
If you would like to credit the Photo, here are some ways you can do so
Text Link
video Link
<span class="text-link">
<span>
<a target="_blank" href=https://pikwizard.com/video/3d-monthly-data-visualization-with-rising-bars/4f6ebd003f41bfd13e7188e1f4c8984b/>PikWizard</a>
</span>
</span>
<span class="image-link">
<span
style="margin: 0 0 20px 0; display: inline-block; vertical-align: middle; width: 100%;"
>
<a
target="_blank"
href="https://pikwizard.com/video/3d-monthly-data-visualization-with-rising-bars/4f6ebd003f41bfd13e7188e1f4c8984b/"
style="text-decoration: none; font-size: 10px; margin: 0;"
>
<video controls style="width: 100%; margin: 0;">
<source src="https://player.vimeo.com/progressive_redirect/playback/722091094/rendition/360p/file.mp4?loc=external&oauth2_token_id=1223210874&signature=57ddee9e96df44dc3dee07038f7e962f268636f0c861ade06907f5b03f72996a" type="video/mp4"
poster="https://pikwizard.com/pw/medium/4f6ebd003f41bfd13e7188e1f4c8984b.jpg"/>
Your browser does not support the video tag.
</video>
<p style="font-size: 12px; margin: 0;">PikWizard</p>
</a>
</span>
</span>
Free (free of charge)
Free for personal and commercial use.
Author: Awesome Content