
- Home >
- Stock Videos >
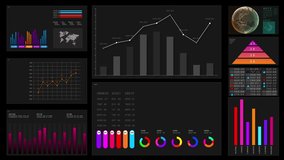
- Abstract Digital Data Visualization with Sine Curve and Bars
Abstract Digital Data Visualization with Sine Curve and Bars Video

Dynamic depiction of digital analytics presents evolving data through rising bars and a sweeping sine curve. It encompasses rotation of gauges and appearance of technological nodes, creating a futuristic, tech-based look. This is ideal for illustrating modern data analysis tools, adding a cutting-edge design effect to dashboards, and perfect for presentations and marketing materials related to data science and technological advancements.
Powered by  - Get 15% off with code: PIKWIZARD15


downloads
Tags:
More
Credit Photo
If you would like to credit the Photo, here are some ways you can do so
Text Link
video Link
<span class="text-link">
<span>
<a target="_blank" href=https://pikwizard.com/video/abstract-digital-data-visualization-with-sine-curve-and-bars/1289d7e8e23cbe0704fc95ac5b4631be/>PikWizard</a>
</span>
</span>
<span class="image-link">
<span
style="margin: 0 0 20px 0; display: inline-block; vertical-align: middle; width: 100%;"
>
<a
target="_blank"
href="https://pikwizard.com/video/abstract-digital-data-visualization-with-sine-curve-and-bars/1289d7e8e23cbe0704fc95ac5b4631be/"
style="text-decoration: none; font-size: 10px; margin: 0;"
>
<video controls style="width: 100%; margin: 0;">
<source src="https://player.vimeo.com/progressive_redirect/playback/1092948073/rendition/240p/file.mp4?loc=external&oauth2_token_id=1223210874&signature=b3645b91a307bd8eb341869788c3ff61992b9a6de2a1f09cb46747cfa28da5fd" type="video/mp4"
poster="https://pikwizard.com/pw/medium/1289d7e8e23cbe0704fc95ac5b4631be.jpg"/>
Your browser does not support the video tag.
</video>
<p style="font-size: 12px; margin: 0;">PikWizard</p>
</a>
</span>
</span>
Free (free of charge)
Free for personal and commercial use.
Author: Awesome Content