
- Home >
- Stock Videos >
- Abstract Financial Charts and Data Visualization
Abstract Financial Charts and Data Visualization Video
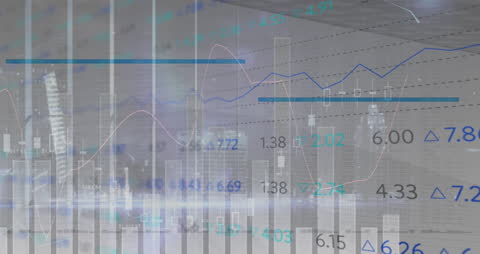
Featuring overlay of financial charts and numerical data, this concept depicts the analytical world of finance and market trends. Ideal for illustrating themes of economic analysis, global business strategies, financial technology innovations, and investment planning.
Powered by 


downloads
Tags:
More
Credit Photo
If you would like to credit the Photo, here are some ways you can do so
Text Link
video Link
<span class="text-link">
<span>
<a target="_blank" href=https://pikwizard.com/video/abstract-financial-charts-and-data-visualization/46e5054cb09d0e98f34a6fd50c485ddf/>PikWizard</a>
</span>
</span>
<span class="image-link">
<span
style="margin: 0 0 20px 0; display: inline-block; vertical-align: middle; width: 100%;"
>
<a
target="_blank"
href="https://pikwizard.com/video/abstract-financial-charts-and-data-visualization/46e5054cb09d0e98f34a6fd50c485ddf/"
style="text-decoration: none; font-size: 10px; margin: 0;"
>
<video controls style="width: 100%; margin: 0;">
<source src="https://player.vimeo.com/progressive_redirect/playback/719020811/rendition/240p/file.mp4?loc=external&oauth2_token_id=1223210874&signature=c2ac9038680326907d82f2546a997960399f64086385443a41460df9a58e8a03" type="video/mp4"
poster="https://pikwizard.com/pw/medium/46e5054cb09d0e98f34a6fd50c485ddf.jpg"/>
Your browser does not support the video tag.
</video>
<p style="font-size: 12px; margin: 0;">PikWizard</p>
</a>
</span>
</span>
Free (free of charge)
Free for personal and commercial use.
Author: Awesome Content