
- Home >
- Stock Videos >
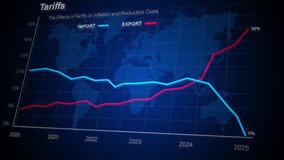
- Abstract Financial Data with Dynamic Graphs and Global Map
Abstract Financial Data with Dynamic Graphs and Global Map Video

Visual depiction of financial and statistical graphs against a background that includes a global map. The futuristic and digital elements showcase an advanced technology concept ideal for themes related to finance, data analysis, investments, and business strategy. Perfect for business presentations, financial reports, websites on market analysis, and educational material on economic trends.
Powered by  - Get 15% off with code: PIKWIZARD15


downloads
Tags:
More
Credit Photo
If you would like to credit the Photo, here are some ways you can do so
Text Link
video Link
<span class="text-link">
<span>
<a target="_blank" href=https://pikwizard.com/video/abstract-financial-data-with-dynamic-graphs-and-global-map/fb0e3ed978771c9f34c7b07ee48508fc/>PikWizard</a>
</span>
</span>
<span class="image-link">
<span
style="margin: 0 0 20px 0; display: inline-block; vertical-align: middle; width: 100%;"
>
<a
target="_blank"
href="https://pikwizard.com/video/abstract-financial-data-with-dynamic-graphs-and-global-map/fb0e3ed978771c9f34c7b07ee48508fc/"
style="text-decoration: none; font-size: 10px; margin: 0;"
>
<video controls style="width: 100%; margin: 0;">
<source src="https://player.vimeo.com/progressive_redirect/playback/790199233/rendition/240p/file.mp4?loc=external&oauth2_token_id=1223210874&signature=ad4fc03347f89fcc48665a79f2688eb8158b4790525a8e3911deadfc7d33cdf6" type="video/mp4"
poster="https://pikwizard.com/pw/medium/fb0e3ed978771c9f34c7b07ee48508fc.jpg"/>
Your browser does not support the video tag.
</video>
<p style="font-size: 12px; margin: 0;">PikWizard</p>
</a>
</span>
</span>
Free (free of charge)
Free for personal and commercial use.
Author: Awesome Content