
- Home >
- Stock Videos >
- Abstract Financial Data with Motion Blur Effect
Abstract Financial Data with Motion Blur Effect Video
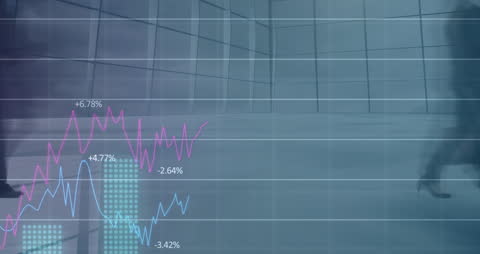
Features dynamic financial graphs with percentages overlaid on abstract, blurred figures in motion. Ideal for illustrating themes related to the stock market, digital interface designs, business analytics, and futuristic financial data processing. Useful for presentations, finance-related websites, and promotional materials focusing on data analysis and business growth.
Powered by 


downloads
Tags:
More
Credit Photo
If you would like to credit the Photo, here are some ways you can do so
Text Link
video Link
<span class="text-link">
<span>
<a target="_blank" href=https://pikwizard.com/video/abstract-financial-data-with-motion-blur-effect/ed1a04066ef6658ffc5328749733a9b8/>PikWizard</a>
</span>
</span>
<span class="image-link">
<span
style="margin: 0 0 20px 0; display: inline-block; vertical-align: middle; width: 100%;"
>
<a
target="_blank"
href="https://pikwizard.com/video/abstract-financial-data-with-motion-blur-effect/ed1a04066ef6658ffc5328749733a9b8/"
style="text-decoration: none; font-size: 10px; margin: 0;"
>
<video controls style="width: 100%; margin: 0;">
<source src="https://player.vimeo.com/progressive_redirect/playback/718171733/rendition/240p/file.mp4?loc=external&oauth2_token_id=1223210874&signature=af12c05c9af9231020b33cf563a730b9fc1f743f142dacf41c4c5a8cffce8f5e" type="video/mp4"
poster="https://pikwizard.com/pw/medium/ed1a04066ef6658ffc5328749733a9b8.jpg"/>
Your browser does not support the video tag.
</video>
<p style="font-size: 12px; margin: 0;">PikWizard</p>
</a>
</span>
</span>
Free (free of charge)
Free for personal and commercial use.
Author: Awesome Content