
- Home >
- Stock Videos >
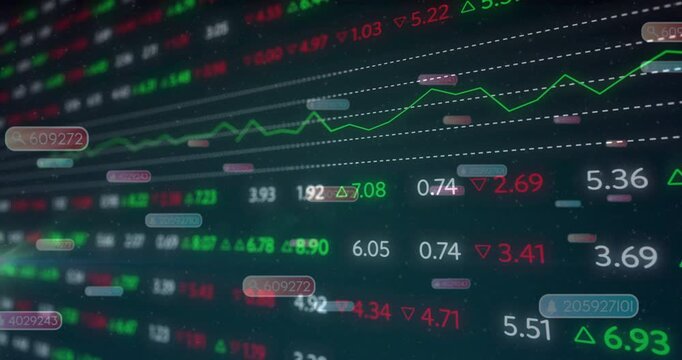
- Abstract Financial Stock Market Data Visualization on Digital Display
Abstract Financial Stock Market Data Visualization on Digital Display Video
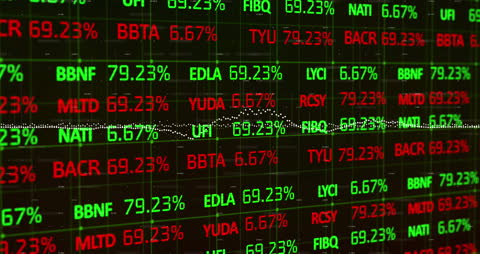
Detailed digital display presenting dynamic stock market data, showing fluctuating prices represented in green and red. This can be perfectly used for articles on financial analysis, global economics presentations, investment trend graphs, or educational materials about stock trading. Due to its abstract representation of financial information, it serves well as a visual reference in materials teaching the basics or complexities of global economy changes.
Powered by 


0
downloads
downloads
Tags:
More
Credit Photo
If you would like to credit the Photo, here are some ways you can do so
Text Link
video Link
<span class="text-link">
<span>
<a target="_blank" href=https://pikwizard.com/video/abstract-financial-stock-market-data-visualization-on-digital-display/3332ceb66e07d5113ff76d681625ae95/>PikWizard</a>
</span>
</span>
<span class="image-link">
<span
style="margin: 0 0 20px 0; display: inline-block; vertical-align: middle; width: 100%;"
>
<a
target="_blank"
href="https://pikwizard.com/video/abstract-financial-stock-market-data-visualization-on-digital-display/3332ceb66e07d5113ff76d681625ae95/"
style="text-decoration: none; font-size: 10px; margin: 0;"
>
<video controls style="width: 100%; margin: 0;">
<source src="https://player.vimeo.com/progressive_redirect/playback/746262935/rendition/240p/file.mp4?loc=external&oauth2_token_id=1223210874&signature=046254245a6b2f762912366dcfbef1940d9f3ea62402cf5b82fcca29217a2ed9" type="video/mp4"
poster="https://pikwizard.com/pw/medium/3332ceb66e07d5113ff76d681625ae95.jpg"/>
Your browser does not support the video tag.
</video>
<p style="font-size: 12px; margin: 0;">PikWizard</p>
</a>
</span>
</span>
Free (free of charge)
Free for personal and commercial use.
Author: Awesome Content