
- Home >
- Stock Videos >
- Advanced Stock Market Data Analysis with Graph and Digital Scanner
Advanced Stock Market Data Analysis with Graph and Digital Scanner Video
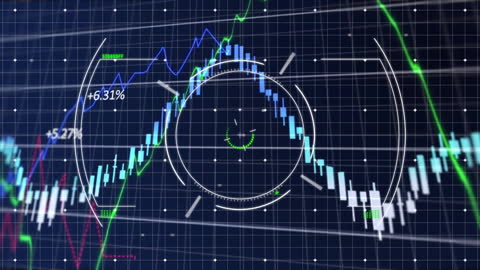
Graphic features an advanced digital representation of stock market data, with a circular scanner overlay and colorful graphs indicating financial trends. Ideal for illustrating concepts in finance, digital markets, technology integration, and business analytics. Useful for presentations, articles on modern trading practices, or educational materials about financial technologies.
Powered by  - Get 15% off with code: PIKWIZARD15


0
downloads
downloads
Tags:
More
Credit Photo
If you would like to credit the Photo, here are some ways you can do so
Text Link
video Link
<span class="text-link">
<span>
<a target="_blank" href=https://pikwizard.com/video/advanced-stock-market-data-analysis-with-graph-and-digital-scanner/5f34024bcc265e946ece8659fc9607dd/>PikWizard</a>
</span>
</span>
<span class="image-link">
<span
style="margin: 0 0 20px 0; display: inline-block; vertical-align: middle; width: 100%;"
>
<a
target="_blank"
href="https://pikwizard.com/video/advanced-stock-market-data-analysis-with-graph-and-digital-scanner/5f34024bcc265e946ece8659fc9607dd/"
style="text-decoration: none; font-size: 10px; margin: 0;"
>
<video controls style="width: 100%; margin: 0;">
<source src="https://player.vimeo.com/progressive_redirect/playback/913852939/rendition/240p/file.mp4?loc=external&oauth2_token_id=1223210874&signature=90fe1cfac6da514a26d32a29656131533e61cdeed5ffd96c0eccf292370df96a" type="video/mp4"
poster="https://pikwizard.com/pw/medium/5f34024bcc265e946ece8659fc9607dd.jpg"/>
Your browser does not support the video tag.
</video>
<p style="font-size: 12px; margin: 0;">PikWizard</p>
</a>
</span>
</span>
Free (free of charge)
Free for personal and commercial use.
Author: Awesome Content