
- Home >
- Stock Videos >
- Algorithmic Trade Analysis Displayed on Global Chart
Algorithmic Trade Analysis Displayed on Global Chart Video
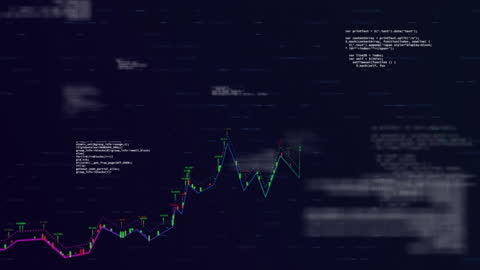
Digital visualization of algorithmic trading patterns displayed on conceptual global chart. Highlights intersection of finance and technology_visual of a fluctuating market trend_abstract artistic correlation of global indices_possible usage in financial technology presentations or business reports.

downloads
Tags:
More
Credit Photo
If you would like to credit the Photo, here are some ways you can do so
Text Link
video Link
<span class="text-link">
<span>
<a target="_blank" href=https://pikwizard.com/video/algorithmic-trade-analysis-displayed-on-global-chart/a6d3154a8c11d14e90acb3efe36ffef1/>PikWizard</a>
</span>
</span>
<span class="image-link">
<span
style="margin: 0 0 20px 0; display: inline-block; vertical-align: middle; width: 100%;"
>
<a
target="_blank"
href="https://pikwizard.com/video/algorithmic-trade-analysis-displayed-on-global-chart/a6d3154a8c11d14e90acb3efe36ffef1/"
style="text-decoration: none; font-size: 10px; margin: 0;"
>
<video controls style="width: 100%; margin: 0;">
<source src="https://player.vimeo.com/progressive_redirect/playback/759804373/rendition/240p/file.mp4?loc=external&oauth2_token_id=1223210874&signature=f8fbd6cbadae2fafd8fceec3c6780eb672d8ef8779473bb1c21a10bde8a66414" type="video/mp4"
poster="https://pikwizard.com/pw/medium/a6d3154a8c11d14e90acb3efe36ffef1.jpg"/>
Your browser does not support the video tag.
</video>
<p style="font-size: 12px; margin: 0;">PikWizard</p>
</a>
</span>
</span>
Free (free of charge)
Free for personal and commercial use.
Author: Awesome Content