
- Home >
- Stock Videos >
- Analyzing Business Growth with Overlapping Data Graphs
Analyzing Business Growth with Overlapping Data Graphs Video
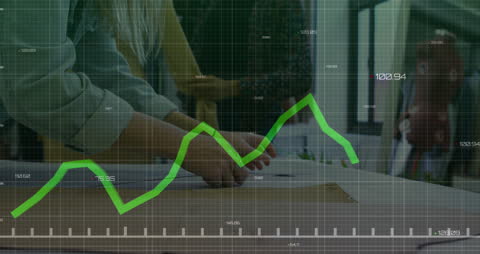
Business growth concept featuring digitized graphs layered over a designer working on fabric patterns. Useful for visualizing complex ideas in financial reports, business presentations, and design projects.
Powered by 


downloads
Tags:
More
Credit Photo
If you would like to credit the Photo, here are some ways you can do so
Text Link
video Link
<span class="text-link">
<span>
<a target="_blank" href=https://pikwizard.com/video/analyzing-business-growth-with-overlapping-data-graphs/58d3b3b8a5d7cef360f17acfa2fd9264/>PikWizard</a>
</span>
</span>
<span class="image-link">
<span
style="margin: 0 0 20px 0; display: inline-block; vertical-align: middle; width: 100%;"
>
<a
target="_blank"
href="https://pikwizard.com/video/analyzing-business-growth-with-overlapping-data-graphs/58d3b3b8a5d7cef360f17acfa2fd9264/"
style="text-decoration: none; font-size: 10px; margin: 0;"
>
<video controls style="width: 100%; margin: 0;">
<source src="https://player.vimeo.com/progressive_redirect/playback/866235344/rendition/240p/file.mp4?loc=external&oauth2_token_id=1223210874&signature=904beec24e52b00b9254d9a0c41c7115caa356e4eb636bb8f7a0b57ea1978c0f" type="video/mp4"
poster="https://pikwizard.com/pw/medium/58d3b3b8a5d7cef360f17acfa2fd9264.jpg"/>
Your browser does not support the video tag.
</video>
<p style="font-size: 12px; margin: 0;">PikWizard</p>
</a>
</span>
</span>
Free (free of charge)
Free for personal and commercial use.
Author: Awesome Content