
- Home >
- Stock Videos >
- Analyzing Data Growth Trends with 3D Graphs and Digital Visuals
Analyzing Data Growth Trends with 3D Graphs and Digital Visuals Video
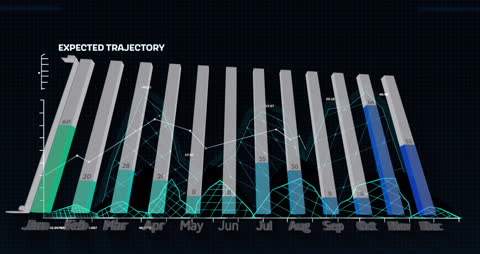
Visualizes data growth and projections using vibrant 3D graphs and digital effects. Perfect for presentations on data analytics, information technology, or business growth trends. Ideal for illustrating complexities and patterns in data-driven environments.
Powered by 


downloads
Tags:
More
Credit Photo
If you would like to credit the Photo, here are some ways you can do so
Text Link
video Link
<span class="text-link">
<span>
<a target="_blank" href=https://pikwizard.com/video/analyzing-data-growth-trends-with-3d-graphs-and-digital-visuals/4f9ca2f9e81a7aa846adecefe6e2317d/>PikWizard</a>
</span>
</span>
<span class="image-link">
<span
style="margin: 0 0 20px 0; display: inline-block; vertical-align: middle; width: 100%;"
>
<a
target="_blank"
href="https://pikwizard.com/video/analyzing-data-growth-trends-with-3d-graphs-and-digital-visuals/4f9ca2f9e81a7aa846adecefe6e2317d/"
style="text-decoration: none; font-size: 10px; margin: 0;"
>
<video controls style="width: 100%; margin: 0;">
<source src="https://player.vimeo.com/progressive_redirect/playback/734850595/rendition/240p/file.mp4?loc=external&oauth2_token_id=1223210874&signature=90905c0852aef5de205a2f399a96c1e7ed41a339df36aeffbf173f3d50c1e113" type="video/mp4"
poster="https://pikwizard.com/pw/medium/4f9ca2f9e81a7aa846adecefe6e2317d.jpg"/>
Your browser does not support the video tag.
</video>
<p style="font-size: 12px; margin: 0;">PikWizard</p>
</a>
</span>
</span>
Free (free of charge)
Free for personal and commercial use.
Author: Awesome Content