
- Home >
- Stock Videos >
- Analyzing Data Patterns Over Grid Network with Technical Indicators
Analyzing Data Patterns Over Grid Network with Technical Indicators Video
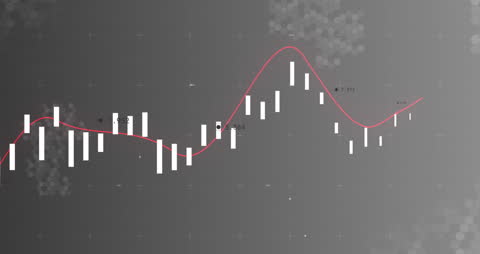
Graphically represents dynamic data patterns over a grid network, ideal for illustrating concepts in data analysis, financial technology, and business intelligence. Suitable for presentations on technical analysis, stock market projections, and AI-driven data processing in finance sectors.

downloads
Tags:
More
Credit Photo
If you would like to credit the Photo, here are some ways you can do so
Text Link
video Link
<span class="text-link">
<span>
<a target="_blank" href=https://pikwizard.com/video/analyzing-data-patterns-over-grid-network-with-technical-indicators/f60f2d049276dd9203f60f2f01b50605/>PikWizard</a>
</span>
</span>
<span class="image-link">
<span
style="margin: 0 0 20px 0; display: inline-block; vertical-align: middle; width: 100%;"
>
<a
target="_blank"
href="https://pikwizard.com/video/analyzing-data-patterns-over-grid-network-with-technical-indicators/f60f2d049276dd9203f60f2f01b50605/"
style="text-decoration: none; font-size: 10px; margin: 0;"
>
<video controls style="width: 100%; margin: 0;">
<source src="https://player.vimeo.com/progressive_redirect/playback/841763849/rendition/240p/file.mp4?loc=external&oauth2_token_id=1223210874&signature=b461bae57aa3d4fb22598f424916964890b56472844657c23ce137255bcff000" type="video/mp4"
poster="https://pikwizard.com/pw/medium/f60f2d049276dd9203f60f2f01b50605.jpg"/>
Your browser does not support the video tag.
</video>
<p style="font-size: 12px; margin: 0;">PikWizard</p>
</a>
</span>
</span>
Free (free of charge)
Free for personal and commercial use.
Author: Awesome Content