
- Home >
- Stock Videos >
- Analyzing Financial Data on Digital Screen with Smartphone
Analyzing Financial Data on Digital Screen with Smartphone Video
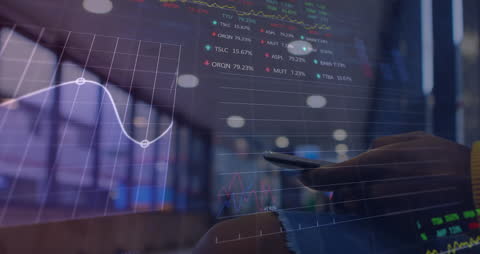
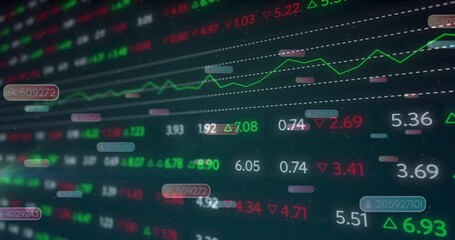
Numbers and graphs from tech industry reflect analysis of financial markets and business situations. Useful in illustrating topics like economics, technological advancements in finance, remote work evaluating market trends.
Powered by 


downloads
Tags:
More
Credit Photo
If you would like to credit the Photo, here are some ways you can do so
Text Link
video Link
<span class="text-link">
<span>
<a target="_blank" href=https://pikwizard.com/video/analyzing-financial-data-on-digital-screen-with-smartphone/9d0e8f27c3cd3374897ba8a63ff627e5/>PikWizard</a>
</span>
</span>
<span class="image-link">
<span
style="margin: 0 0 20px 0; display: inline-block; vertical-align: middle; width: 100%;"
>
<a
target="_blank"
href="https://pikwizard.com/video/analyzing-financial-data-on-digital-screen-with-smartphone/9d0e8f27c3cd3374897ba8a63ff627e5/"
style="text-decoration: none; font-size: 10px; margin: 0;"
>
<video controls style="width: 100%; margin: 0;">
<source src="https://player.vimeo.com/progressive_redirect/playback/745991660/rendition/240p/file.mp4?loc=external&oauth2_token_id=1223210874&signature=4b008cabacbbf4b19a1705112d4ec87f23fda1500b4f23d570c2bad4be35850b" type="video/mp4"
poster="https://pikwizard.com/pw/medium/9d0e8f27c3cd3374897ba8a63ff627e5.jpg"/>
Your browser does not support the video tag.
</video>
<p style="font-size: 12px; margin: 0;">PikWizard</p>
</a>
</span>
</span>
Free (free of charge)
Free for personal and commercial use.
Author: Awesome Content