
- Home >
- Stock Videos >
- Analyzing Financial Data on Tablet with Digital Graph Overlay
Analyzing Financial Data on Tablet with Digital Graph Overlay Video
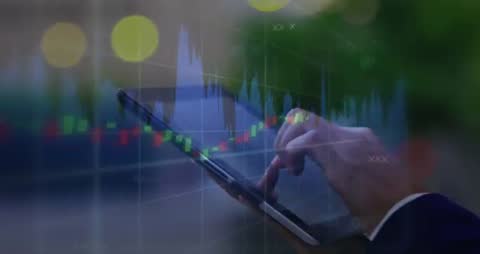
Scene shows person engaging with financial graphs on a tablet, depicting futuristic and tech-driven process of analyzing stock market data. Highlights the blend of technology and financial analytics, illustrating concepts like economics or digital investments. Useful for illustrating modern finance trends in presentations, articles, and educational materials focused on business and technology.
Powered by 


downloads
Tags:
More
Credit Photo
If you would like to credit the Photo, here are some ways you can do so
Text Link
video Link
<span class="text-link">
<span>
<a target="_blank" href=https://pikwizard.com/video/analyzing-financial-data-on-tablet-with-digital-graph-overlay/b9362ed9361d3a7be44c8072fd9c7a7b/>PikWizard</a>
</span>
</span>
<span class="image-link">
<span
style="margin: 0 0 20px 0; display: inline-block; vertical-align: middle; width: 100%;"
>
<a
target="_blank"
href="https://pikwizard.com/video/analyzing-financial-data-on-tablet-with-digital-graph-overlay/b9362ed9361d3a7be44c8072fd9c7a7b/"
style="text-decoration: none; font-size: 10px; margin: 0;"
>
<video controls style="width: 100%; margin: 0;">
<source src="https://player.vimeo.com/progressive_redirect/playback/1066218380/rendition/720p/file.mp4?loc=external&oauth2_token_id=1223210874&signature=bf8a7aa870af98afc8befbc8b922e8827adaa96954ee70d8aaf782077b1f8473&user_id=91254407" type="video/mp4"
poster="https://pikwizard.com/pw/medium/b9362ed9361d3a7be44c8072fd9c7a7b.jpg"/>
Your browser does not support the video tag.
</video>
<p style="font-size: 12px; margin: 0;">PikWizard</p>
</a>
</span>
</span>
Free (free of charge)
Free for personal and commercial use.
Author: Awesome Content