
- Home >
- Stock Videos >
- Analyzing Financial Data with Digital Overlay
Analyzing Financial Data with Digital Overlay Video
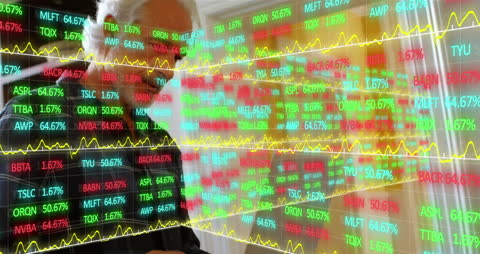
Caucasian man immersed in financial analysis with stock market graphs and data overlays. Ideal for use in business presentations, financial reports, or articles exploring modern finance technology and investment strategies.
Powered by 


downloads
Tags:
More
Credit Photo
If you would like to credit the Photo, here are some ways you can do so
Text Link
video Link
<span class="text-link">
<span>
<a target="_blank" href=https://pikwizard.com/video/analyzing-financial-data-with-digital-overlay/5b0de0d36484d1892c0f216065850ac3/>PikWizard</a>
</span>
</span>
<span class="image-link">
<span
style="margin: 0 0 20px 0; display: inline-block; vertical-align: middle; width: 100%;"
>
<a
target="_blank"
href="https://pikwizard.com/video/analyzing-financial-data-with-digital-overlay/5b0de0d36484d1892c0f216065850ac3/"
style="text-decoration: none; font-size: 10px; margin: 0;"
>
<video controls style="width: 100%; margin: 0;">
<source src="https://player.vimeo.com/progressive_redirect/playback/788578386/rendition/240p/file.mp4?loc=external&oauth2_token_id=1223210874&signature=5b08b029e445fe0934be62f5a22f21440139cdde9fa24f43d1781831be311d82" type="video/mp4"
poster="https://pikwizard.com/pw/medium/5b0de0d36484d1892c0f216065850ac3.jpg"/>
Your browser does not support the video tag.
</video>
<p style="font-size: 12px; margin: 0;">PikWizard</p>
</a>
</span>
</span>
Free (free of charge)
Free for personal and commercial use.
Author: Awesome Content