
- Home >
- Stock Videos >
- Analyzing Financial Data with Eye Chart Visual Overlay
Analyzing Financial Data with Eye Chart Visual Overlay Video
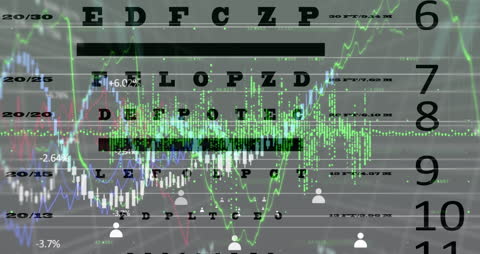
Visual representing complex financial data blending with an eye chart, symbolizing sharp focus in economic analysis. Ideal for topics related to finance, investment strategies, economic forecasts, and budgeting insights.
Powered by  - Get 15% off with code: PIKWIZARD15


downloads
Tags:
More
Credit Photo
If you would like to credit the Photo, here are some ways you can do so
Text Link
video Link
<span class="text-link">
<span>
<a target="_blank" href=https://pikwizard.com/video/analyzing-financial-data-with-eye-chart-visual-overlay/3721d140ded3c8f070c76584ce4c1d27/>PikWizard</a>
</span>
</span>
<span class="image-link">
<span
style="margin: 0 0 20px 0; display: inline-block; vertical-align: middle; width: 100%;"
>
<a
target="_blank"
href="https://pikwizard.com/video/analyzing-financial-data-with-eye-chart-visual-overlay/3721d140ded3c8f070c76584ce4c1d27/"
style="text-decoration: none; font-size: 10px; margin: 0;"
>
<video controls style="width: 100%; margin: 0;">
<source src="https://player.vimeo.com/progressive_redirect/playback/718606720/rendition/240p/file.mp4?loc=external&oauth2_token_id=1223210874&signature=f0f7795c9d80390c8ffcae787f8c2786514b681e803b40b7342dc7f08c718d18" type="video/mp4"
poster="https://pikwizard.com/pw/medium/3721d140ded3c8f070c76584ce4c1d27.jpg"/>
Your browser does not support the video tag.
</video>
<p style="font-size: 12px; margin: 0;">PikWizard</p>
</a>
</span>
</span>
Free (free of charge)
Free for personal and commercial use.
Author: Awesome Content