
- Home >
- Stock Videos >
- Analyzing Financial Data with Virtual Graph Projections
Analyzing Financial Data with Virtual Graph Projections Video
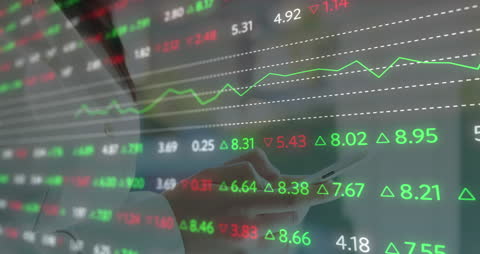
Depiction of a professional examining stock data insights through smartphone, illuminated with virtual graph projected in blue and white data streams all around. Ideal for illustrating themes related to fintech, data-driven decision-making, market analysis, and digital transformation in business.

downloads
Tags:
More
Credit Photo
If you would like to credit the Photo, here are some ways you can do so
Text Link
video Link
<span class="text-link">
<span>
<a target="_blank" href=https://pikwizard.com/video/analyzing-financial-data-with-virtual-graph-projections/fbbe0d7ff336cad09553191ebc94be7c/>PikWizard</a>
</span>
</span>
<span class="image-link">
<span
style="margin: 0 0 20px 0; display: inline-block; vertical-align: middle; width: 100%;"
>
<a
target="_blank"
href="https://pikwizard.com/video/analyzing-financial-data-with-virtual-graph-projections/fbbe0d7ff336cad09553191ebc94be7c/"
style="text-decoration: none; font-size: 10px; margin: 0;"
>
<video controls style="width: 100%; margin: 0;">
<source src="https://player.vimeo.com/progressive_redirect/playback/738828598/rendition/240p/file.mp4?loc=external&oauth2_token_id=1223210874&signature=c63b9d58b5b0d4f1c9a33254ecb356dd4ee1d65501cecab2ef51618f1a4fd8c1" type="video/mp4"
poster="https://pikwizard.com/pw/medium/fbbe0d7ff336cad09553191ebc94be7c.jpg"/>
Your browser does not support the video tag.
</video>
<p style="font-size: 12px; margin: 0;">PikWizard</p>
</a>
</span>
</span>
Free (free of charge)
Free for personal and commercial use.
Author: Awesome Content