
- Home >
- Stock Videos >
- Animated Business Data Processing Overlaid on Scrap Junkyard
Animated Business Data Processing Overlaid on Scrap Junkyard Video
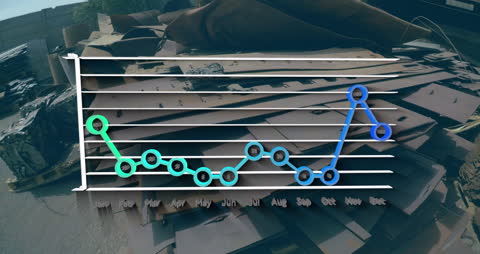
Dynamic animation of a line graph representing monthly business data overlaid on a background of a scrap junkyard. The visual suggests connections between environmental recycling and business analytics. This graphic can illustrate trends in recycling rates, emphasize the importance of sustainable materials management, or be used in presentations promoting environmental technology solutions.
Powered by 


3
downloads
downloads
Tags:
More
Credit Photo
If you would like to credit the Photo, here are some ways you can do so
Text Link
video Link
<span class="text-link">
<span>
<a target="_blank" href=https://pikwizard.com/video/animated-business-data-processing-overlaid-on-scrap-junkyard/f28c30b2e99cdbc9046d0ce0279d788a/>PikWizard</a>
</span>
</span>
<span class="image-link">
<span
style="margin: 0 0 20px 0; display: inline-block; vertical-align: middle; width: 100%;"
>
<a
target="_blank"
href="https://pikwizard.com/video/animated-business-data-processing-overlaid-on-scrap-junkyard/f28c30b2e99cdbc9046d0ce0279d788a/"
style="text-decoration: none; font-size: 10px; margin: 0;"
>
<video controls style="width: 100%; margin: 0;">
<source src="https://player.vimeo.com/progressive_redirect/playback/736755941/rendition/240p/file.mp4?loc=external&oauth2_token_id=1223210874&signature=0f2675bba3cf28a721eacbf5a703f821505acddde8df8df0f0030e20228e3c15" type="video/mp4"
poster="https://pikwizard.com/pw/medium/f28c30b2e99cdbc9046d0ce0279d788a.jpg"/>
Your browser does not support the video tag.
</video>
<p style="font-size: 12px; margin: 0;">PikWizard</p>
</a>
</span>
</span>
Free (free of charge)
Free for personal and commercial use.
Author: Awesome Content