
- Home >
- Stock Videos >
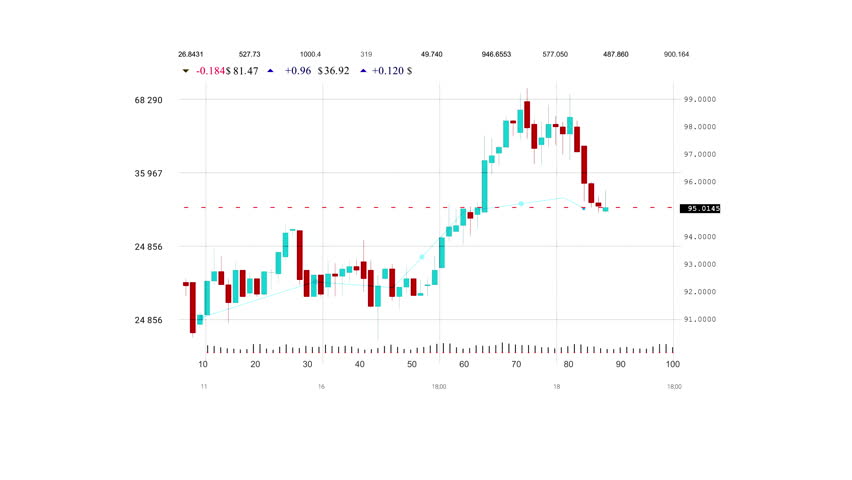
- Animated candlestick chart showing bullish surge with moving averages and particle flow
Animated candlestick chart showing bullish surge with moving averages and particle flow Video

AI Generated Image. Looping video showing green candlestick bars climbing across deep red backdrop with smooth moving average lines and dynamic particle network, conveying bullish market momentum and heightened volatility. Visual style combining candlestick chart animation, neon color contrast, and abstract data particles for modern fintech aesthetic. Suitable for opening sequences, market update clips, trading platform intros, financial news overlays, social media ads, course lessons on technical analysis, crypto market recap reels, and investor pitch decks. Customization ideas: adjusting color palette to match brand, slowing animation for emphasis, adding ticker overlay or voiceover for narration, or layering explanatory text for tutorial content. Working well for illustrating upward price action, breakout scenarios, algorithmic trading demos, and investor sentiment storytelling.
Powered by  - Get 15% off with code: PIKWIZARD15


0
downloads
downloads
Tags:
More
Credit Photo
If you would like to credit the Photo, here are some ways you can do so
Text Link
video Link
<span class="text-link">
<span>
<a target="_blank" href=https://pikwizard.com/video/animated-candlestick-chart-showing-bullish-surge-with-moving-averages-and-particle-flow/4e3d26ef37e391b60abcbe097d8bc6b0/>PikWizard</a>
</span>
</span>
<span class="image-link">
<span
style="margin: 0 0 20px 0; display: inline-block; vertical-align: middle; width: 100%;"
>
<a
target="_blank"
href="https://pikwizard.com/video/animated-candlestick-chart-showing-bullish-surge-with-moving-averages-and-particle-flow/4e3d26ef37e391b60abcbe097d8bc6b0/"
style="text-decoration: none; font-size: 10px; margin: 0;"
>
<video controls style="width: 100%; margin: 0;">
<source src="https://player.vimeo.com/progressive_redirect/playback/1137161773/rendition/240p/file.mp4?loc=external&oauth2_token_id=1223210874&signature=11579088f4be2ad3ae3582d587efa9e92b007ec55259291c43cda7e189d29012" type="video/mp4"
poster="https://pikwizard.com/pw/medium/4e3d26ef37e391b60abcbe097d8bc6b0.jpg"/>
Your browser does not support the video tag.
</video>
<p style="font-size: 12px; margin: 0;">PikWizard</p>
</a>
</span>
</span>
Free (free of charge)
Free for personal and commercial use.
Author: AI Creator