
- Home >
- Stock Videos >
- Animated Covid Statistics with Digital Charts and Data Visualizations
Animated Covid Statistics with Digital Charts and Data Visualizations Video
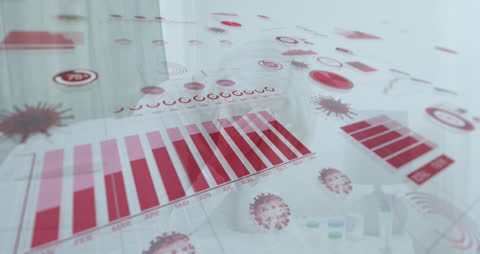
Visualization highlights digital charts and pandemic-related statistics in red hues. Perfect for educational presentations, health-related news, or online blogs discussing COVID-19 impacts. Supports themes on global health awareness and statistical analysis tools.

downloads
Tags:
More
Credit Photo
If you would like to credit the Photo, here are some ways you can do so
Text Link
video Link
<span class="text-link">
<span>
<a target="_blank" href=https://pikwizard.com/video/animated-covid-statistics-with-digital-charts-and-data-visualizations/6f7ab39f460f88682882a007b4e6ab3f/>PikWizard</a>
</span>
</span>
<span class="image-link">
<span
style="margin: 0 0 20px 0; display: inline-block; vertical-align: middle; width: 100%;"
>
<a
target="_blank"
href="https://pikwizard.com/video/animated-covid-statistics-with-digital-charts-and-data-visualizations/6f7ab39f460f88682882a007b4e6ab3f/"
style="text-decoration: none; font-size: 10px; margin: 0;"
>
<video controls style="width: 100%; margin: 0;">
<source src="https://player.vimeo.com/progressive_redirect/playback/717466778/rendition/240p/file.mp4?loc=external&oauth2_token_id=1223210874&signature=11935dd18a997159f49ab28e7742114d9095552abe404a230d494b37c2d076fe" type="video/mp4"
poster="https://pikwizard.com/pw/medium/6f7ab39f460f88682882a007b4e6ab3f.jpg"/>
Your browser does not support the video tag.
</video>
<p style="font-size: 12px; margin: 0;">PikWizard</p>
</a>
</span>
</span>
Free (free of charge)
Free for personal and commercial use.
Author: Awesome Content